Free chart generator: type your numbers, get the chart, change it by talking
November 16, 2026
Open nixm's data viz template, type your numbers in plain words or paste them, and the chart is drawn right in the conversation. Then change it by asking: other colours, the numbers on the bars, a line instead of bars. As a free chart generator it is free to start, not free forever: you can start without an account, a free account comes with starter credits, and after that each chart and each change is one chat credit. Credits never expire.
Is it really a free chart generator?
Free to start, yes. You can open nixm and make a chart without an account. A free account comes with starter credits on top of that. Past those, a chart is one chat credit and every change to it is one more, and the credits you buy never expire. The chart is drawn from the numbers you give it, so the bars, labels and totals are your data, not a picture of a chart.
How to make a chart in nixm
Open the data viz template. Go to nixm.ai/NIXM-DATA-V1Z1. It is set up for one job: turning numbers into a chart. Your first message makes your own copy, so the template stays as it was for the next person.
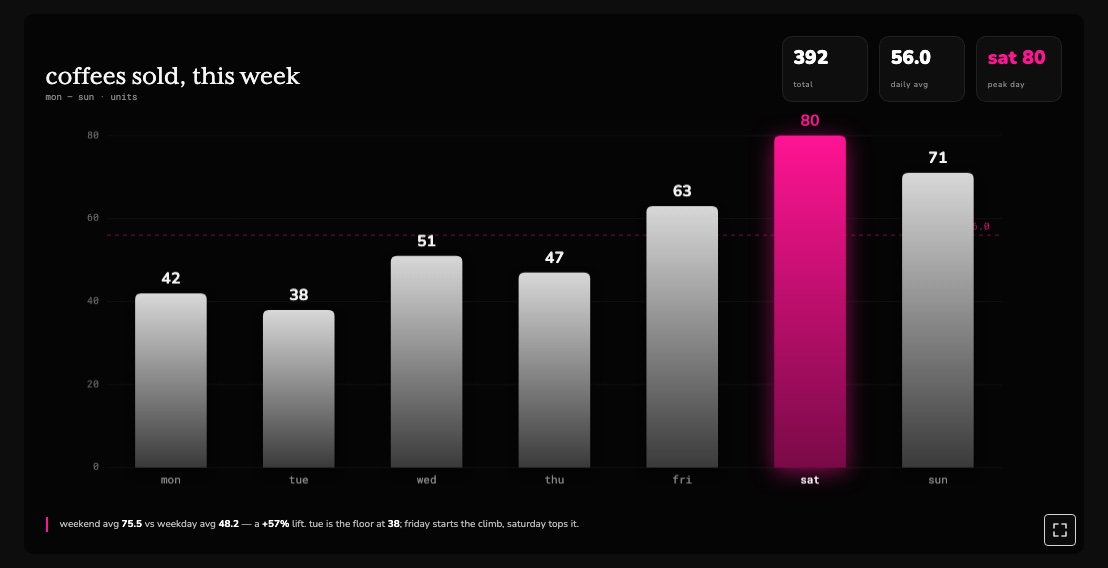
Type your numbers. Plain words are enough: "coffees sold this week: mon 42, tue 38, wed 51, thu 47, fri 63, sat 80, sun 71. a bar chart please". Rows pasted from a spreadsheet or a CSV work too, or attach a .csv, .txt or .json file.
Send it. The chart is drawn in the conversation, labelled, as nixm's reply. That is one chat message.
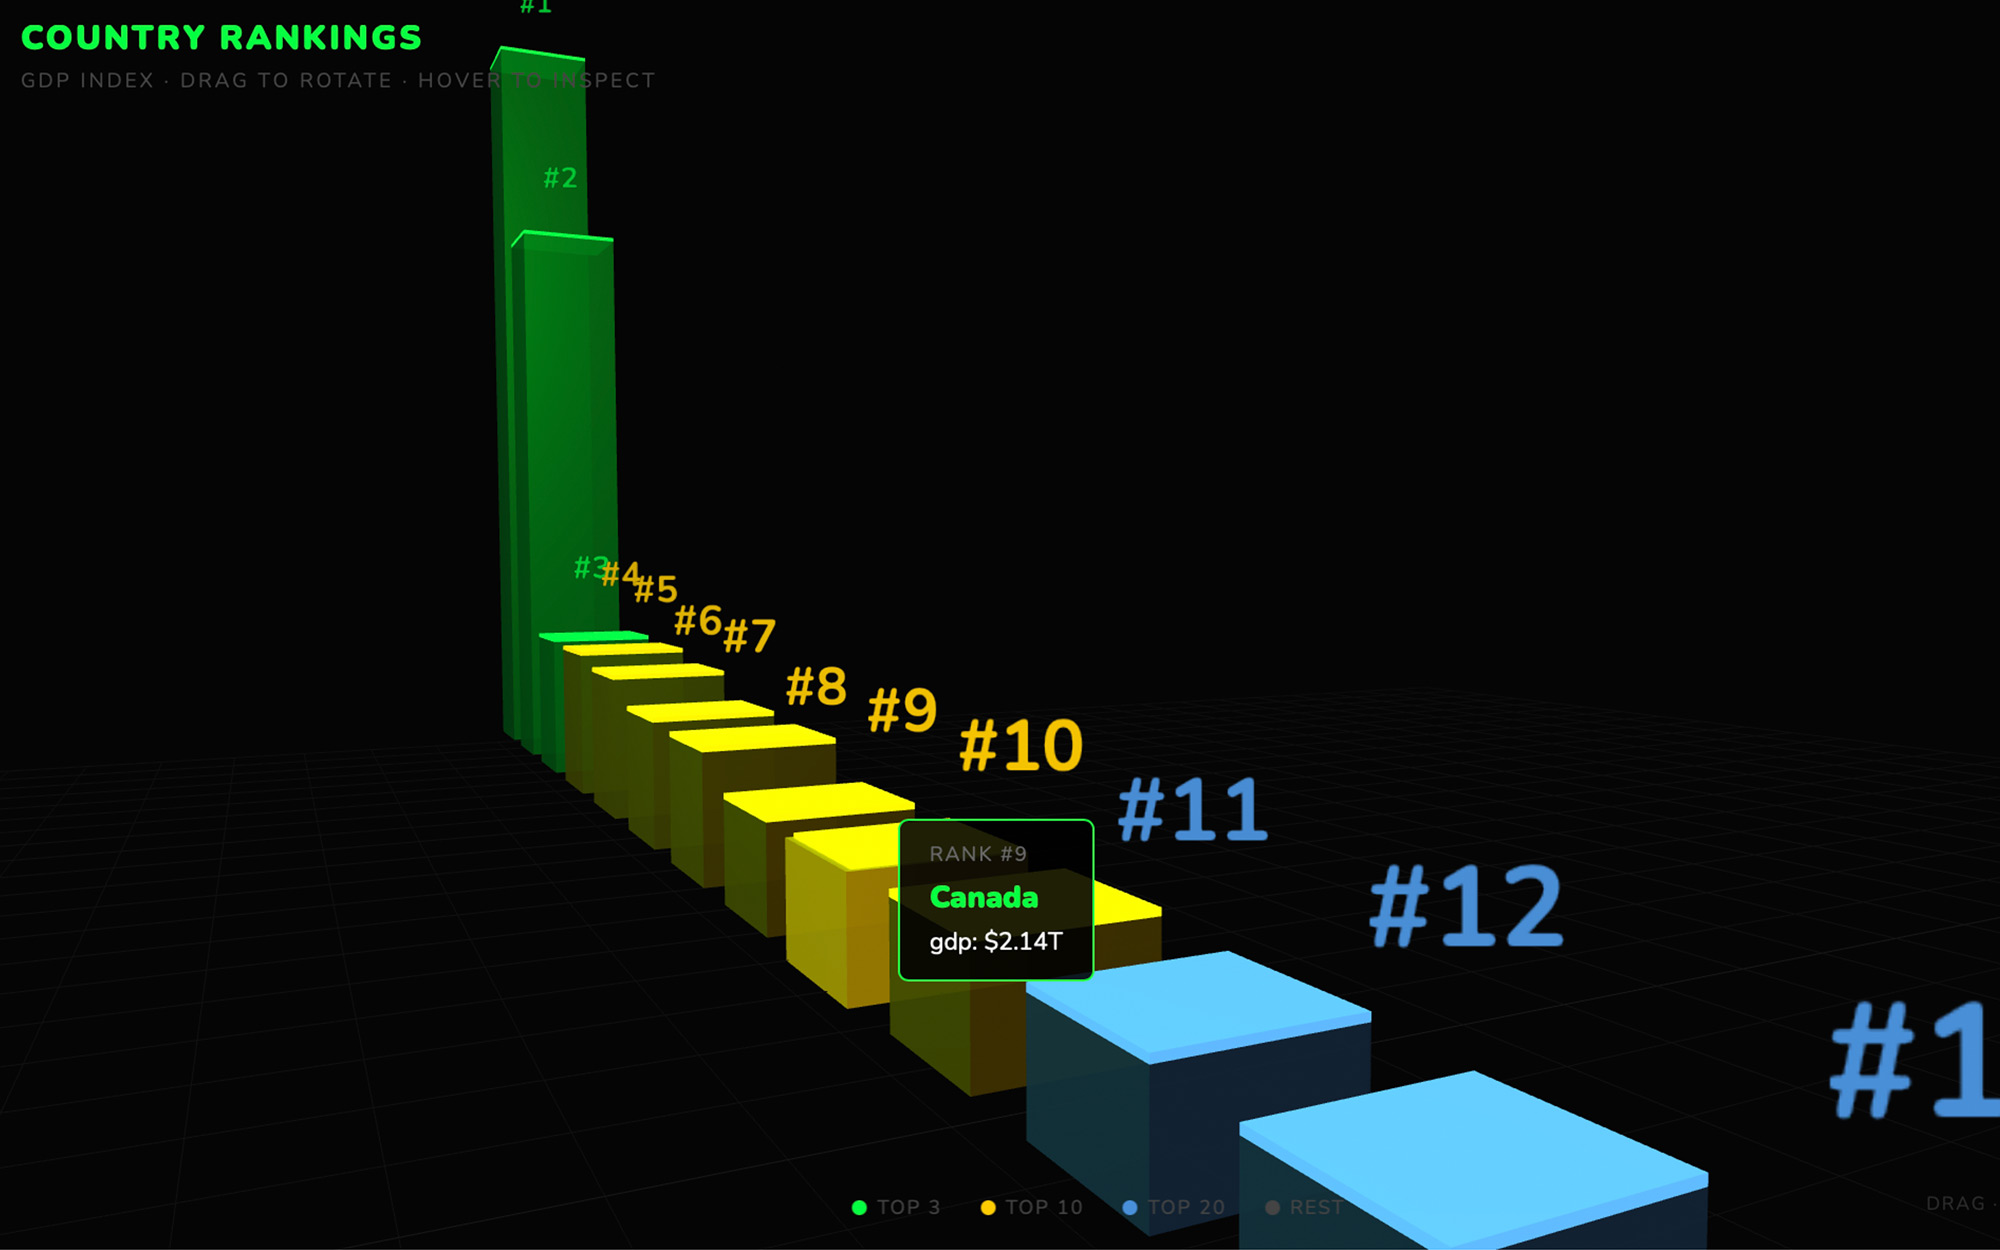
The chart from that one line: seven numbers, one message. nixm added the total, the daily average and the peak day on its own.
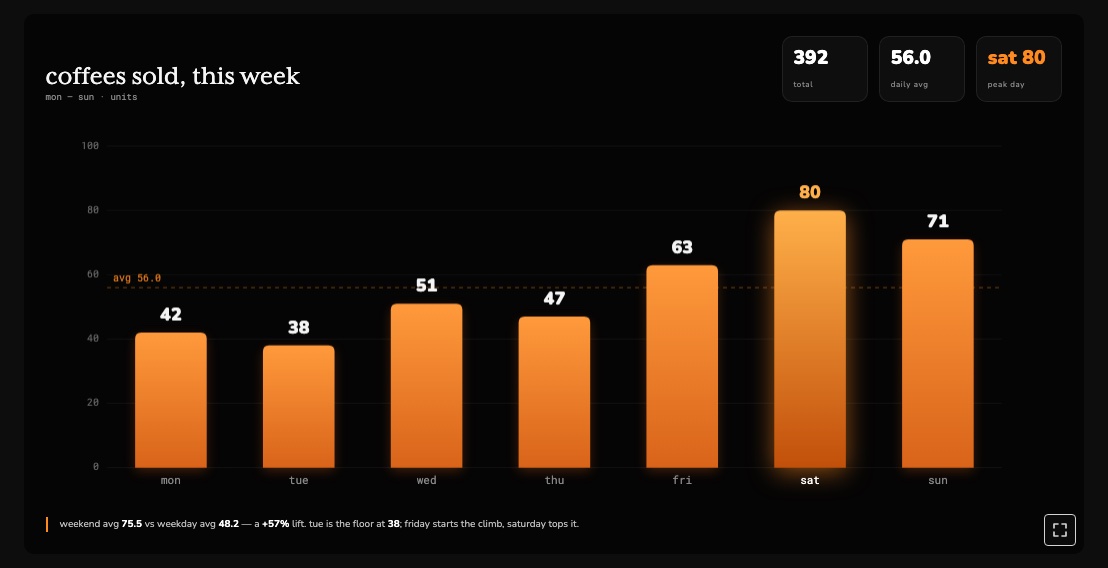
Change it by talking. "Make the bars warm orange and put the number on top of each bar." "Make it a line chart." "Sort it biggest first." "Add a title." Each change redraws the chart, for one more chat message.
One message later: "make the bars warm orange and put the number on top of each bar".
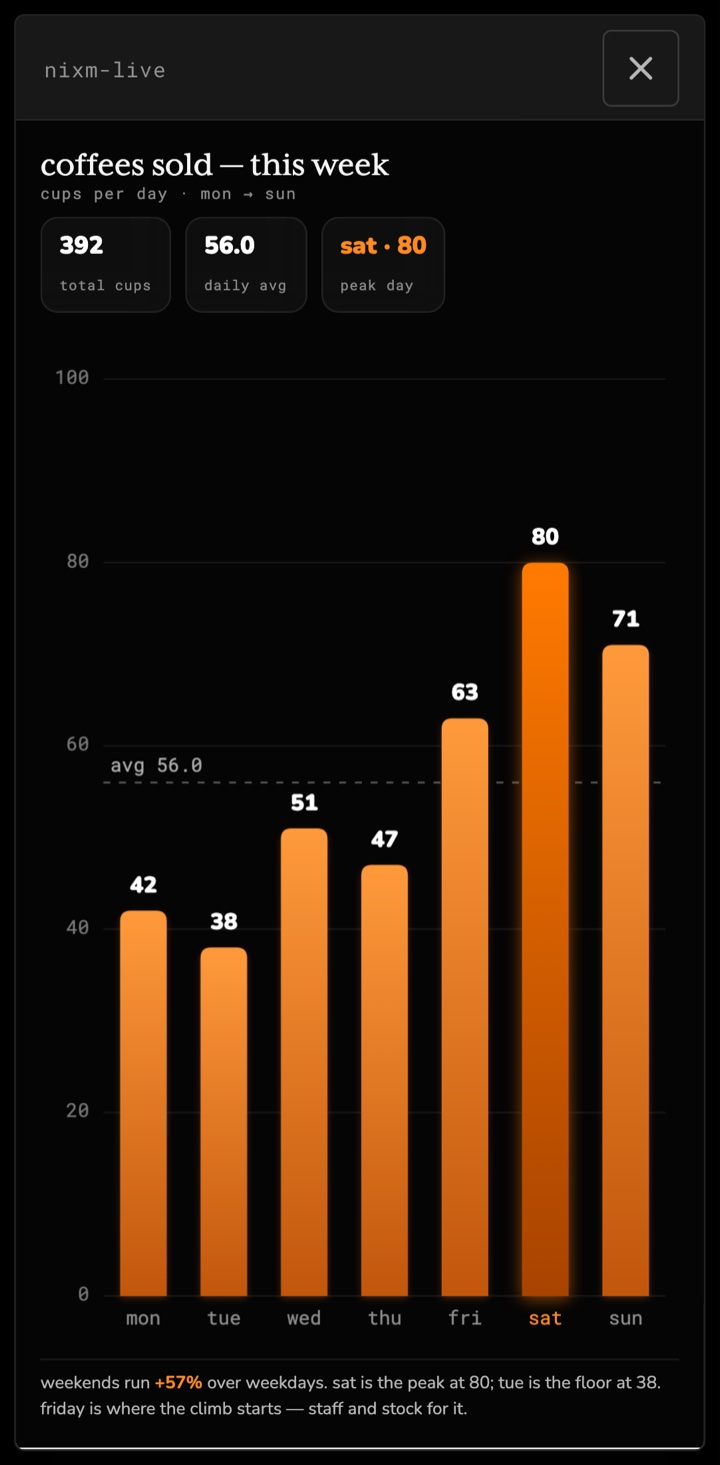
Open it full size. The icon in the corner of the chart opens it fullscreen. On a phone the chart sits in a short box in the conversation, so fullscreen is where you see all of it.
Fullscreen on a phone.
Take it with you. Ask "give me the code for this chart". It comes back as a code block with a download button, and the file opens in any browser. There is no image download button for the chart itself; for a picture to drop into slides, take a screenshot of the fullscreen view.
What to type for a clean chart
Name each number. "mon 42, tue 38" beats "42, 38": the names become the labels.
Say what it counts. "coffees sold", "minutes", "revenue in thousands" ends up in the title and saves a round of corrections.
Say the chart if you have one in mind. Bars to compare things, a line for change over time. If you do not, nixm picks one and you can ask for another.
For pasting bigger tables and picking between chart types, the step-by-step is in how to make a graph with AI.
What stays and what goes
Signed in, the latest chart stays on your signal and shows on its page, so the link you share shows it too. Signed out, nothing is saved: ask for the code before you close the tab. A signal dissolves after seven days unless you extend it, one credit for seven more days.
What it costs
You can start without an account. A free account comes with starter credits. After that, one chat credit per chart and one per change, and credits never expire. To try it, open the data viz template and type the numbers you have in front of you.
try it now
ask anything. nothing is kept.
no account, no transcript kept. even the signal dissolves in seven days.
Yes. In nixm you can start without an account: open the data viz template, type your numbers and the chart is drawn in the conversation. Signing in keeps the latest chart on your signal.
Is nixm a completely free chart generator?
It is free to start, not free forever. You can start without an account and a free account comes with starter credits. After that each chart and each change is one chat credit, and credits never expire.
Can I make a chart from numbers I type?
Yes. Plain words work, like mon 42, tue 38, wed 51, and so do CSV rows or lines copied from a spreadsheet. You can also attach a csv, txt or json file.
Can I change the colours or the chart type?
Yes, by asking in plain words, like make the bars orange or make it a line chart. Each change redraws the chart for one chat credit.
Can I download the chart?
Ask for the code and it comes back as a code block with a download button; the file opens in any browser. There is no image download button, so for a picture take a screenshot of the fullscreen view.
Do I need Excel or Google Sheets?
No. Type the numbers or paste them. An Excel file is not read directly, so save it as CSV first or copy the rows into the chat.
read next
How to make a graph with AI, step by stepPaste a CSV or a messy list and get a clean, labelled graph back, then change it by asking. Step by step, what it costs, and how to take it with you.
AI infographic generator: from a list of facts to a graphic you can postMake an infographic with AI from a list of facts, a paragraph or a table. nixm lays it out live in the conversation with real charts from your numbers and generated images where they help, then changes it when you say so. What it does well, what to ask for, and how to take it with you.
AI presentation maker: from your notes to slides you can presentMake a presentation with AI from an outline, notes or one sentence. nixm writes the slides, generates pictures to match, shows the deck live in the conversation, and changes it when you say so. What it can and cannot export, and how to ask for a deck people will sit through.
no transcript kept — think out loud with an ai that forgets on purpose. no account. seed a signal →aucune transcription conservée — pensez à voix haute avec une ia qui oublie exprès. sans compte. amorcer un signal →
Enter your email and receive a link to sign in. No passwords, just a secure signal to connect.
why connect
20 free credits to start
your signals, remembered
buy more credits anytime
image & video generation features
or
signal transmitted
check your email for the magic link. click it to connect.
defaults for new renders on this signal. collaborators see them read-only.
shape
clip qualityHD = 1 credit · 4K = 2
scene length3–30 s
optional
existing takes don't change
+
What
a nixm is a document that thinks back.
a thought. a thread. a session. a frequency.
you seed it. it holds. you share it. they're talking to you.
most AI is a blank room — you arrive, explain yourself, leave, and it forgets everything. every session starts from zero.
nixm™ works differently. you seed it with intent — a goal, a problem, a mindset. it locks to that frequency and stays there. then it gives you something you can share: a nixm.
a nixm is a unique URL that carries your primed intelligence with it. anyone who opens it enters the same focused context you created — no re-explaining, no lost thread. the AI already knows what matters. see how it works →
we measured it — a signal against a full chat thread, same model, pre-registered →
why a link, not a chat
a shared chat link is a read-only transcript — a record of a dead session. a custom persona is a blank slate every new user starts cold. a nixm is neither: when someone opens yours, they step into a live session that already holds your intent. no setup. no onboarding. the frequency is already locked.
use case 01 — the list
seed a nixm with a shared goal. everyone with the link adds to it in real time. no group chat. no context collapse.
NIXM-JACK-H0ME
→ party prep
→ fix the back lights
→ borrow grill from Dan
use case 02 — the brief
seed a nixm with a direction. share the signal — your team enters the same mental model instantly, no onboarding. the AI holds the thread. everyone adds to it in the same frequency.
NIXM-BRAN-D1R3
→ brand direction q1
→ bold, not loud
→ editorial tone
→ team adds perspectives
use case 03 — the proxy
seed a nixm with your thinking on a problem. the signal holds your lens — when others open it, they're working inside your framing, not starting over.
NIXM-HIRE-PL4N
→ hiring plan q2
→ prioritize senior IC over lead
→ budget locked at 2 headcount
→ remote-first, no exceptions
use case 04 — the visual
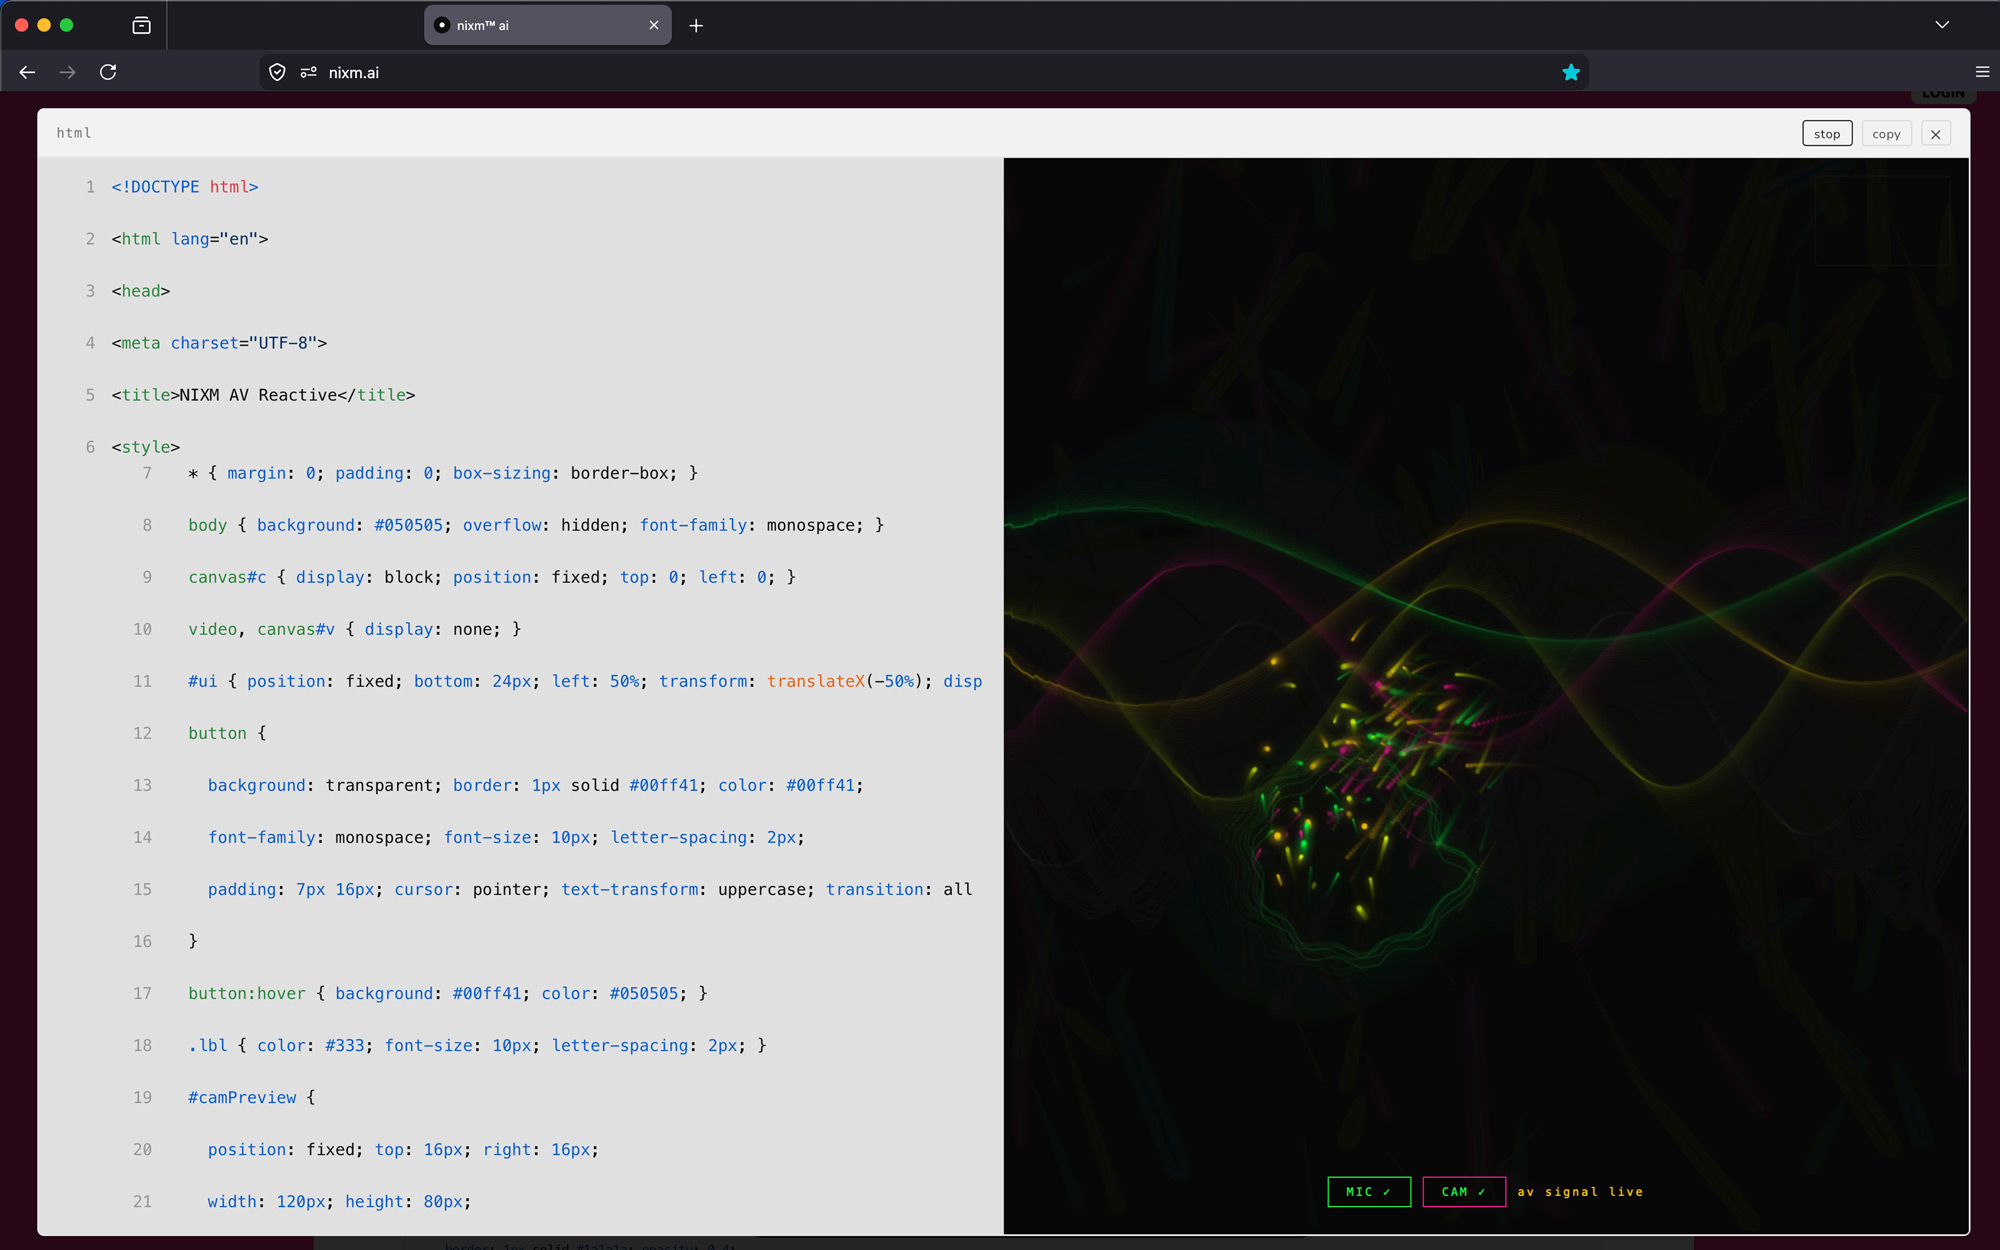
ask nixm™ to show you something — a particle field, a chart, a 3D scene, an interactive demo — and it renders live, right inside the conversation. or go further: images and cinematic video with sound, rendered from a sentence — or a researched doc with its sources linked. no extra tools.
"show me q1 growth in 3d"
"generate a portrait, golden hour"
"make it a clip, with sound"
→ renders inline, instantly
the ephemeral vow
no transcript of the dialogue is kept, and the signal's distilled log dissolves after seven days. no thread to leak, no archive to mine, no training data to opt out of — the most private AI conversation is one that never existed. your insights stay with you. the noise returns to nothing.
vous l'amorcez. il retient. vous le partagez. c'est à vous qu'ils parlent.
la plupart des IA sont une pièce vide — vous arrivez, vous vous expliquez, vous partez, et tout est oublié. chaque session repart de zéro.
nixm™ fonctionne autrement. vous l'amorcez avec une intention — un objectif, un problème, un état d'esprit. il se verrouille sur cette fréquence et y reste. puis il vous rend quelque chose de partageable : un nixm.
un nixm est une URL unique qui transporte avec elle votre intelligence déjà amorcée. quiconque l'ouvre entre dans le contexte exact que vous avez créé — rien à réexpliquer, aucun fil perdu. l'IA sait déjà ce qui compte. voir comment ça marche →
on l'a mesuré — un signal face à un fil complet, même modèle, protocole enregistré d'avance →
pourquoi un lien, pas une conversation
un lien de conversation partagé n'est qu'une transcription en lecture seule — la trace d'une session morte. un personnage sur mesure est une page blanche que chaque nouvel arrivant découvre à froid. un nixm n'est ni l'un ni l'autre : quand quelqu'un ouvre le vôtre, il entre dans une session vivante qui porte déjà votre intention. aucune configuration. aucun tutoriel. la fréquence est déjà verrouillée.
cas d'usage 01 — la liste
amorcez un nixm avec un objectif commun. toute personne ayant le lien y contribue en temps réel. pas de discussion de groupe. pas d'effondrement du contexte.
NIXM-JACK-H0ME
→ préparatifs de la fête
→ acheter bière + glace
→ réparer les lumières de derrière
→ emprunter le barbecue de Dan
cas d'usage 02 — le brief
amorcez un nixm avec une direction. partagez le signal — votre équipe entre instantanément dans le même modèle mental, sans tutoriel. l'IA tient le fil. chacun y contribue sur la même fréquence.
NIXM-BRAN-D1R3
→ direction de marque t1
→ affirmé, pas tapageur
→ ton éditorial
→ l'équipe ajoute ses angles
cas d'usage 03 — le relais
amorcez un nixm avec votre réflexion sur un problème. le signal conserve votre angle — quand d'autres l'ouvrent, ils travaillent dans votre cadrage, sans repartir de zéro.
NIXM-HIRE-PL4N
→ plan de recrutement t2
→ privilégier un profil senior autonome plutôt qu'un lead
→ budget bloqué à 2 postes
→ télétravail par défaut, sans exception
cas d'usage 04 — le visuel
demandez à nixm™ de vous montrer quelque chose — un champ de particules, un graphique, une scène 3D, une démo interactive — et il le rend en direct, dans la conversation même. ou allez plus loin : des images et de la vidéo cinématographique avec son, générées à partir d'une phrase — ou un document de recherche, sources en lien. aucun outil supplémentaire.
« montre-moi la croissance du t1 en 3d »
« génère un portrait, heure dorée »
« transforme-le en clip, avec son »
→ rendu dans le fil, instantanément
le serment éphémère
aucune transcription du dialogue n'est conservée, et le journal condensé du signal se dissout après sept jours. aucun fil à fuiter, aucune archive à exploiter, aucune donnée d'entraînement à refuser — la conversation IA la plus privée est celle qui n'a jamais existé. vos idées restent avec vous. le bruit retourne au néant.
open nixm™. type what's actually on your mind — not a command, just your intent. raw and direct. you're setting the frequency.
"prep for jack's party this weekend"
"think through our brand direction for q1"
"build me a qr generator"
step 02: get your nixm
nixm™ locks to your intent and hands you back a nixm — a URL that holds your primed intelligence. anyone who opens it steps into the same context, immediately.
send it to your team — they step into the same frequency instantly, no setup. or keep it private: the nixm holds your context until you return.
→ share it with anyone
→ or save it for yourself
→ the nixm doesn't care — it just holds
start one
the fastest way to understand a nixm is to seed one. close this and type what's actually on your mind — that's the whole first step. seed a nixm →
trois étapes. un nixm.
vous l'écrivez. il se verrouille. vous le partagez.
aucune configuration. aucun tutoriel. aucune ingénierie de prompt.
étape 01 : amorcez votre intention
ouvrez nixm™. écrivez ce que vous avez vraiment en tête — pas une commande, juste votre intention. brute et directe. c'est vous qui réglez la fréquence.
« préparer la fête de jack ce week-end »
« réfléchir à notre direction de marque pour le t1 »
« construis-moi un générateur de qr »
étape 02 : recevez votre nixm
nixm™ se verrouille sur votre intention et vous rend un nixm — une URL qui porte votre intelligence déjà amorcée. quiconque l'ouvre entre dans le même contexte, immédiatement.
envoyez-le à votre équipe — elle entre instantanément sur la même fréquence, sans configuration. ou gardez-le privé : le nixm conserve votre contexte jusqu'à votre retour.
→ partagez-le avec qui vous voulez
→ ou gardez-le pour vous
→ le nixm s'en moque — il retient, c'est tout
amorcez-en un
le moyen le plus rapide de comprendre un nixm, c'est d'en amorcer un. fermez ceci et écrivez ce que vous avez vraiment en tête — c'est toute la première étape. amorcer un nixm →
Manifesto
intelligence is temporary. intent is absolute.
01 — the signal
a lens, not a mirror
standard AI reflects whoever it's talking to in that moment. it has no anchor, no loyalty to your intent. nixm™ is different: you seed it, it locks. the signal holds your context from the first word to the last.
02 — the seed
your intent, shared
when you share a signal, you're not forwarding a chat link. you're distributing a specific mental model — a primed intelligence that thinks from your original intent, not from whatever someone types next.
03 — transientially you.™
a flash of synchronized thought
a signal is not a permanent record — it dissolves seven days after it is created, along with its distilled log and any images you uploaded. it is a temporary alignment — your intent, amplified. the insights stay with you. the noise returns to the void. every signal, alive →
04 — the interface
not a tool. a membrane.
tools are things you pick up and put down. an interface is a place where two different things meet and exchange. by stripping everything else away, nixm™ forces the focus onto what matters: the raw exchange of thought. and every setting is a thing that has to be stored about you — so stripping the interface down isn't only about focus. it's about what's left to keep.
nixm™ began as an experiment in minimalist intelligence — a rebellion against complex, bloated AI platforms that need a manual to operate. it remains a work in progress. an evolving interface.
l'intelligence est temporaire. l'intention est absolue.
01 — le signal
une lentille, pas un miroir
l'IA standard reflète celui ou celle à qui elle parle sur le moment. aucun ancrage, aucune loyauté envers votre intention. nixm™ fonctionne autrement : vous l'amorcez, il se verrouille. le signal retient votre contexte du premier mot au dernier.
02 — l'amorce
votre intention, partagée
lorsque vous partagez un signal, vous ne transférez pas un lien de conversation. vous diffusez un modèle mental précis — une intelligence déjà amorcée qui pense depuis votre intention d'origine, et non depuis ce que la personne suivante tape.
03 — transientially you.™
un éclair de pensée synchronisée
un signal n'est pas un enregistrement permanent — il se dissout sept jours après sa création, avec son journal condensé et les images que vous avez importées. c'est un alignement temporaire — votre intention, amplifiée. les idées restent avec vous. le bruit retourne au néant. chaque signal, vivant →
04 — l'interface
pas un outil. une membrane.
un outil, on le prend puis on le repose. une interface est un lieu où deux choses différentes se rencontrent et échangent. en retirant tout le reste, nixm™ force l'attention sur l'essentiel : l'échange brut de la pensée. et chaque réglage est une chose qu'il faut conserver à votre sujet — dépouiller l'interface n'est donc pas qu'une question de concentration. c'est une question de ce qu'il reste à garder.
nixm™ est né comme une expérience d'intelligence minimaliste — une révolte contre les plateformes d'IA complexes et surchargées qui exigent un manuel pour fonctionner. c'est toujours un travail en cours. une interface qui évolue.
lab
the chatgpt alternative that arrives already briefed.
most ai — chatgpt included — starts every conversation from zero. you arrive, explain yourself, refine, re-refine. nixm doesn't work like that.
two signals. one mind.
most AI starts every conversation from zero. you arrive, explain yourself, refine, re-refine, watch the model drift back to defaults. five messages to reach one good answer. ten more to keep it on track.
nixm™ flips that. every nixm has two signals primed before you ever arrive — an intent signal that holds the mission, and a collab signal that holds the settings.
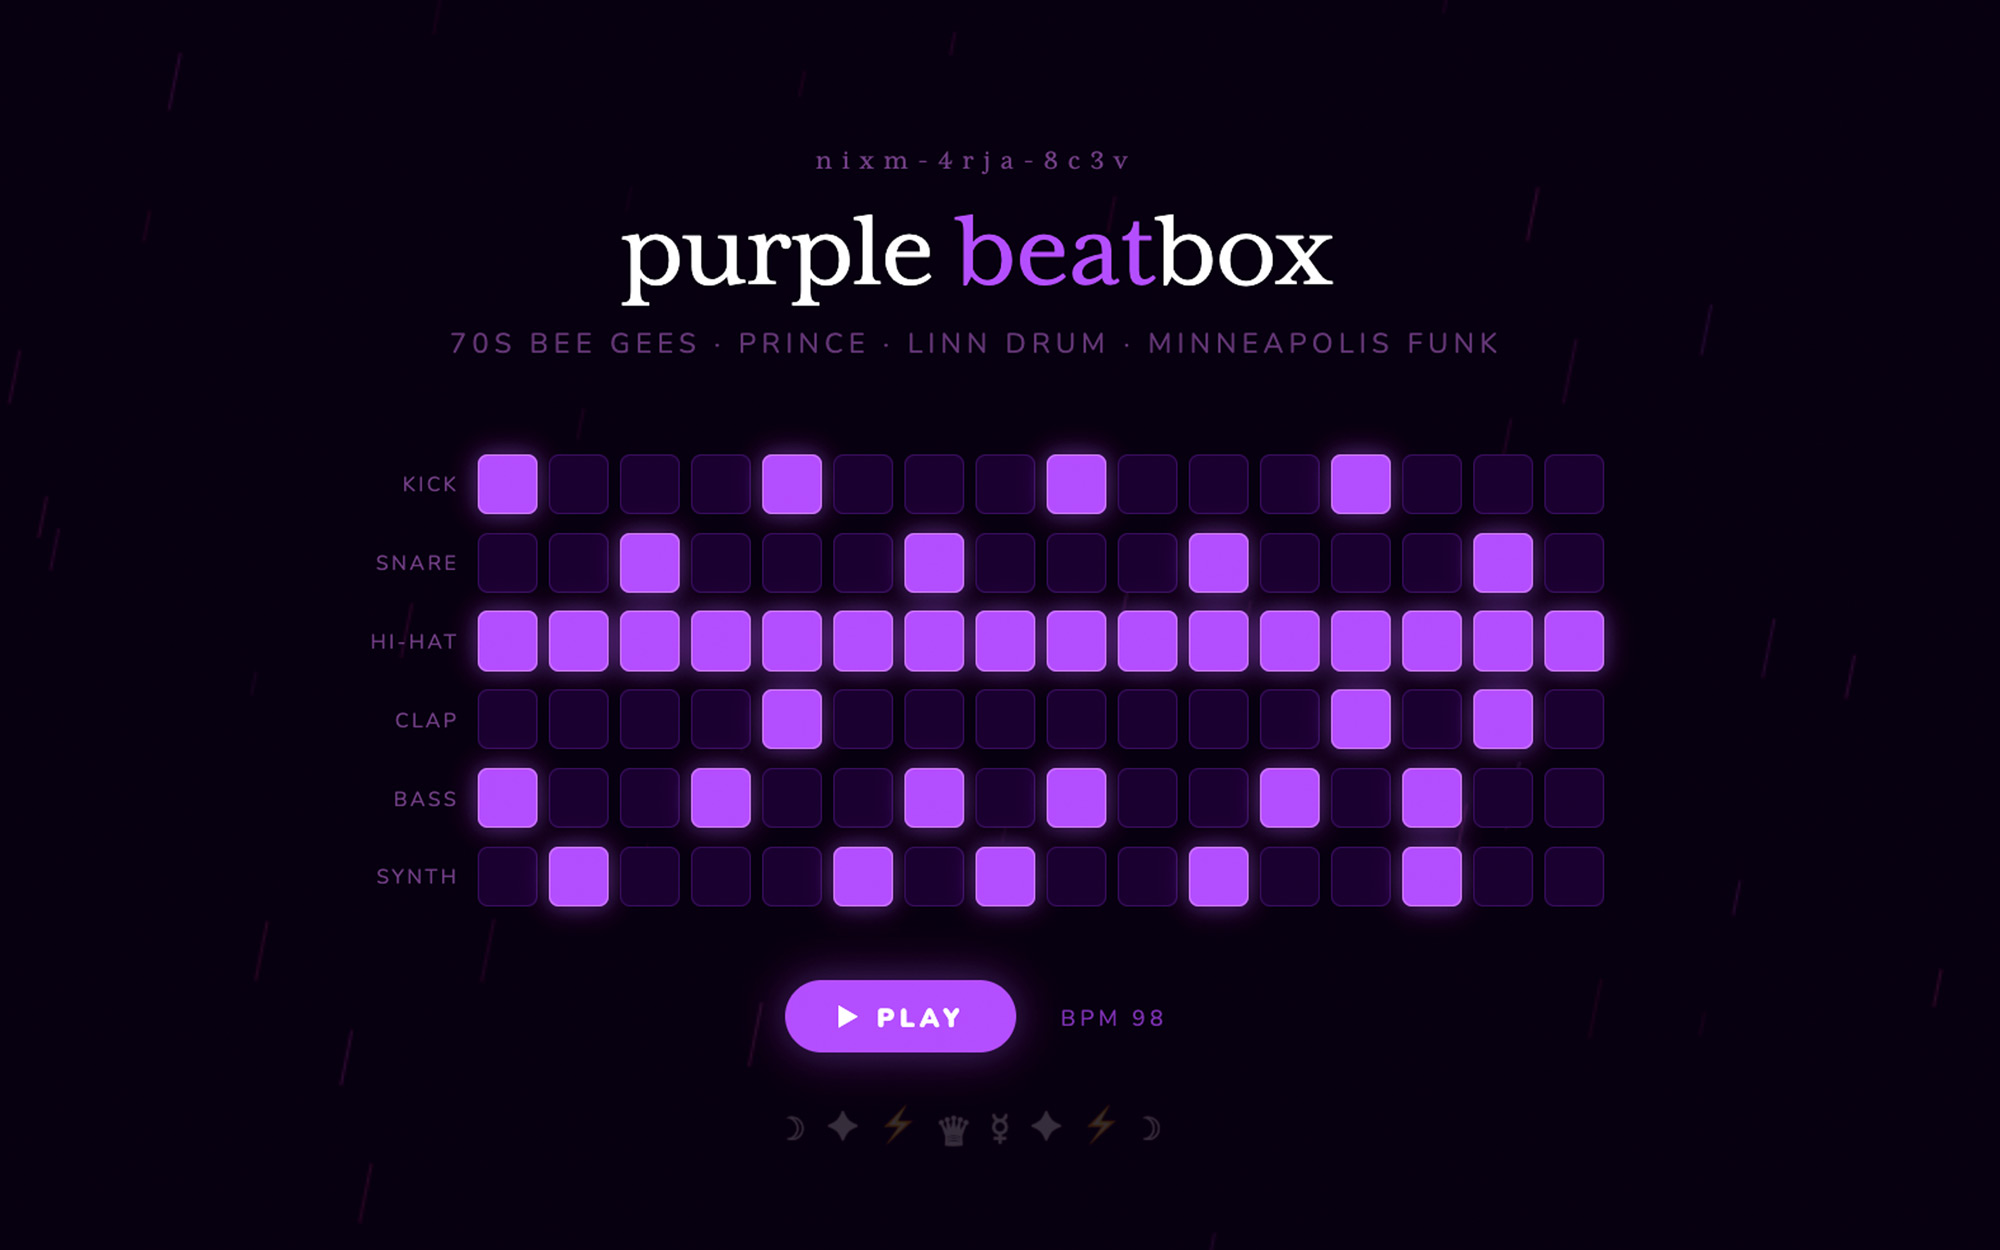
intent is what you're trying to make. build a beatbox. write a brand brief in editorial tone. visualize photosynthesis in 3d. that signal is locked from the moment the URL loads.
collab is everything else — constraints, voice, references, what to avoid, what to lean into. it's the producer's notes. the model isn't reading them when you arrive. they were already in the room.
you say one thing. nixm™ answers refined.
this is the difference. not the model — the model is interchangeable. the difference is that nixm™ hands the model a primed signal, not a blank room.
recent unlocks.
capabilities that surfaced from the lab. fresh frequencies, freshly tuned.
CAST
the same face, a new scene. most AI video forgets your character between clips — you describe her again and a stranger comes back. cast a character once, from a photo or a frame you rendered, name it, and it holds. then direct it anywhere: an alley at 3am, a desert at golden hour, two characters in one frame. 3 to 30 seconds, one shot or several, landscape or vertical — 1 video credit per 5 seconds, sound in the same pass. nixm shows you the shot and the price before it spends anything. holding a character across a whole sequence is its own craft — what continuity actually takes.
a cast character that speaks. give her a line and the voice and the mouth come back together, in one pass. nothing recorded, nothing dubbed. lip sync works: a line you write is spoken on the character's lips. short lines fit an 8-second shot. two takes, and what seems to make the difference: what a spoken line does on nixm, from two clips.
direct a single unforgettable frame. tell nixm a fragment — a character, a mood, a moment you half-see — and it casts the scene with you: lens, light, motion, the decisive instant. when the frame lands, set it in motion as a short clip. you bring the spark. nixm directs. if you have never done this before, the route from idea to finished clip is the place to start. if you came from sora, here is where to make video now.
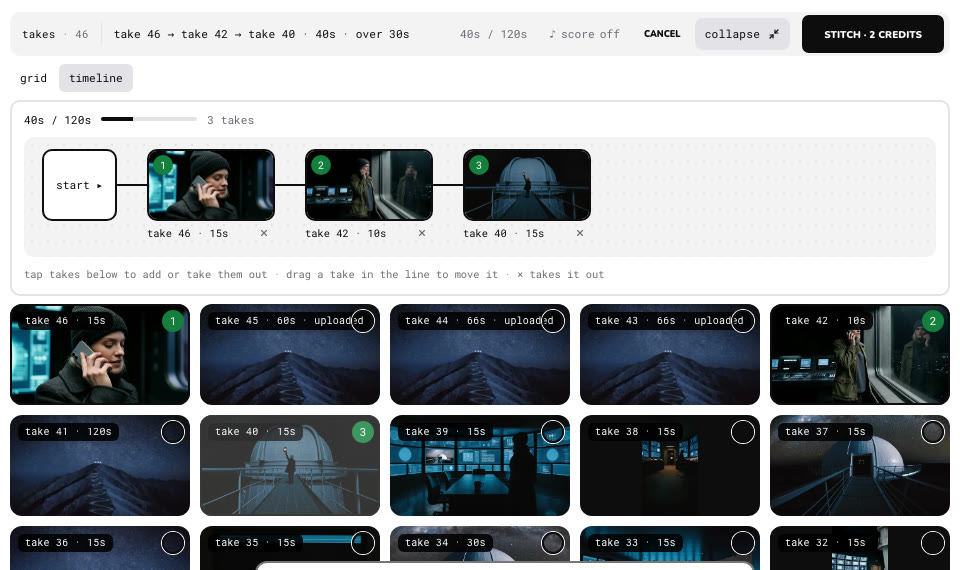
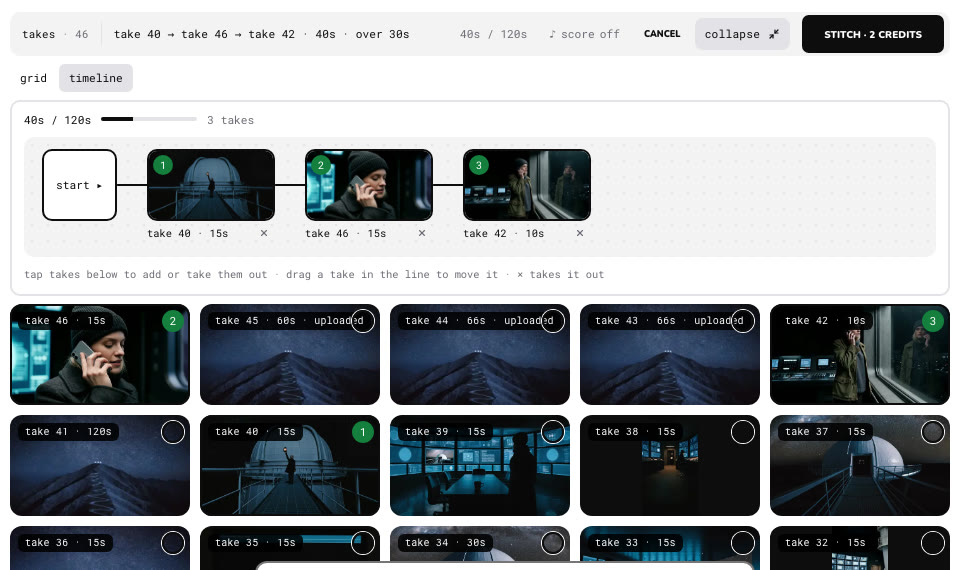
see the order before you stitch. open your takes with “all N”, switch to timeline, and tap takes to add them — each joins a wired line in the order you tap it. drag a take to move it, × takes it out. the line keeps the running length against 120s, and STITCH shows the price before anything is spent: 1 video credit per 30s, + SCORE one more. 2 to 8 takes, as with STITCH.
three takes tapped into the line, the last one dragged to the front — the order, the length and the price follow. recorded on a real signal, nothing spent.
remix
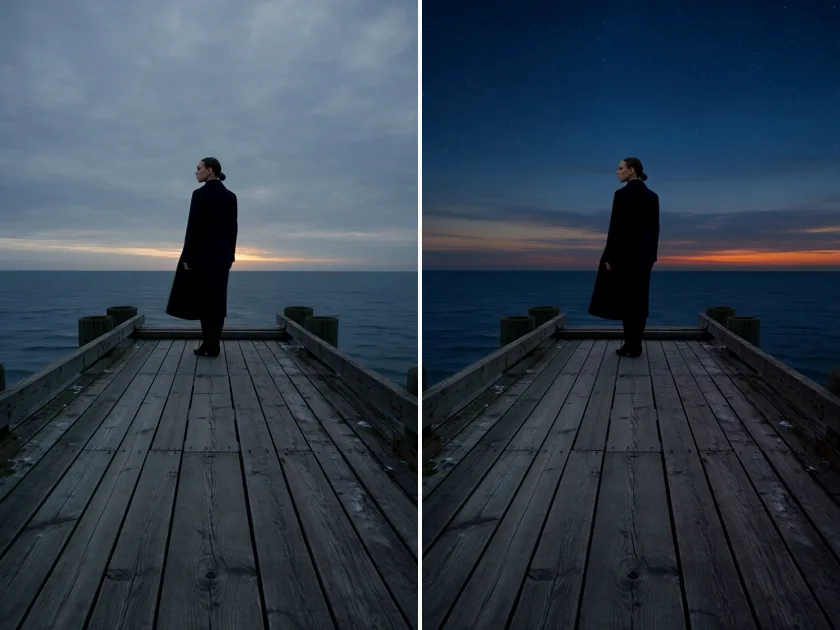
one take, changed by a sentence. open a take of 30 seconds or less and tap REMIX — beside DOWNLOAD, and under the newest take — then finish the sentence: what should change. "make it night." "add rain." the camera move, the framing, the timing and the sound stay; only what you named changes. it lands as a new take, and the original stays. or just ask: "remix take 4 so it's night". lettering on screen may not come out exact.
1 video credit per 5 seconds, plus 1 — a 5s take is 2, 8s is 3, 15s is 4, 30s is 7. a 4K take comes back in 1080p. charged only when it lands.
your takes, one video. on a signal with two or more takes, tap STITCH and pick 2 to 8 of them in the order you want — nixm™ joins them with hard cuts, each take keeping its own sound, everything framed to the first one, in HD. you see the length and the price before anything is spent: 1 video credit per 30s, up to 120s (4 credits). or just ask: "stitch take 3, 5 and 7". the originals stay; the stitch is a new take. + SCORE puts an instrumental score under it, cut to the length, dialogue kept clear — one more credit.
pick your takes in order, see the length and the price, one click — the stitch plays like any render and becomes the newest take. a real stitch on a test signal.
live
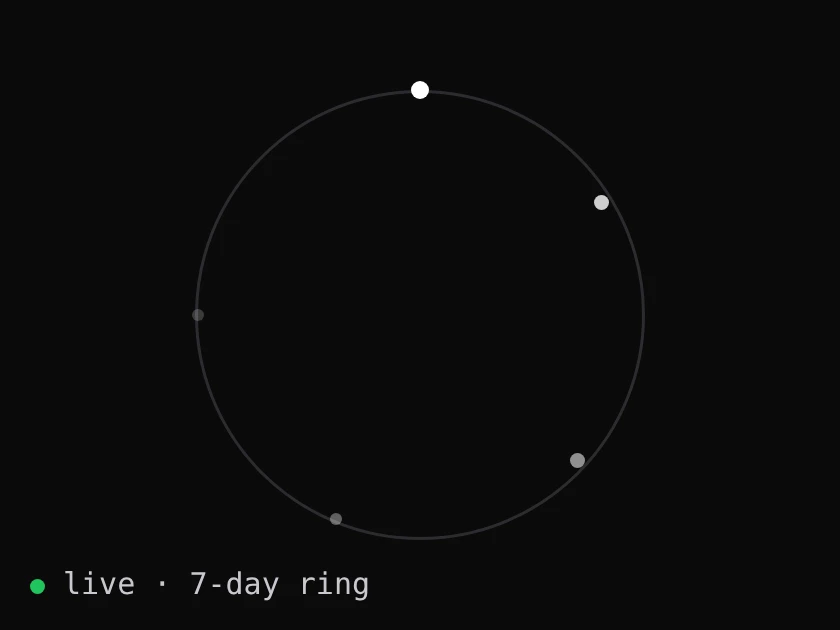
every signal, alive. each signal on nixm™ right now, as a point of light on a seven-day ring: born at the top, dissolving where it began. no names, no words, no owners. only how long each one has left.
a researched doc, not a guess. ask nixm™ to look something up — or tap search the web when it's offered — and in about 10–15 seconds a short doc opens beside the chat: a direct answer, the findings, every source linked. it lands in the signal's research row, and nixm™ remembers what it found.
2 chat credits, charged only when the doc arrives. go deeper: a longer, sectioned report — 6 credits.
eight seconds is where the shot starts, not where it ends. every finished clip now carries an EXTEND button — one press and the same shot carries on for about seven more seconds, one credit, no plan to join. press it again if it's still going somewhere. we cut the join down to about two tenths of a second by telling the model what it must not change; the writeup is in what extending a clip really does.
ask for a video, get a video. eight seconds, with its sound (a spoken line, ambience) in one pass. inline on mobile, side panel on desktop — expand, play, download. landscape, portrait, or square, detected from how you ask. HD or 4K — 1 video credit for HD, 2 for 4K. the sound is generated with the picture rather than added after — why that changes the result. how it compares with the rest of the field is in the best ai video generators of 2026.
image gen
ask for an image, get an image. inline on mobile, side panel on desktop — expand, scroll, download. square, landscape, or portrait, detected from how you ask. 2 chat credits each. any image you make here can be set in motion as a clip. you can make the still without an account; what no sign-up actually gets you.
templates
pre-tuned signals for common modes. start a session already focused.
code that runs as it appears. ask nixm™ to show something visual and it renders live in the chat — no buttons, no waiting.
the runner
every code block is executable. expand any block to a full surface, run it, and watch the output. iterate without leaving the conversation.
every nixm is shareable.
seed a nixm. share the link. anyone who opens it enters the same focused intelligence you created — no setup, no re-explaining. the frequency holds for everyone.
signup free — 20 credits, plus a free video on us. drop your email to claim.
enter your email, then login to generate image or video.
next: nixms that act. not just a thread you share — a session that moves, drafts, and does. nixm™ is learning to reach.
Enter your email
CHECK YOUR EMAIL — 20 CREDITS + A FREE VIDEO WAITING.
a nixm is a unique URL that carries your primed AI context with it. you seed it with intent, it locks to that frequency, and anyone who opens the link enters the same focused intelligence you created. no setup, no re-explaining.
seed a signal, open its link anywhere — the context is already there. a demo signal; the replies are real.
nixm™, a nixm, a signal — which is which?
three words, three things.
nixm™ is the interface — the thing you're using right now.
a nixm is what you make with it: a URL that holds your intent. seed one, share it, come back to it.
a signal is the intent itself, locked in place. every nixm carries one — that's what makes it hold. (under the hood it's primed on two: an intent signal and a collab signal. that's the machinery, not something you set.)
short version: you use nixm™ to make a nixm, and the signal is what's locked inside it.
does the name nixm mean anything?
not really. it's a name — short, a little strange at first, and it grows on you.
can nixm show me things — charts, visuals, demos?
yes. ask nixm™ to show, visualize, render, or animate something and it renders live inline — particles, 3D scenes, charts, interactive demos. data and ideas, made visible. for code you want to keep, copy, or modify, ask it to build something instead — that gives you the full source with a toolbar to expand, copy, and export. for pictures, ask it to generate an image — square, landscape, or portrait, rendered inline.
can nixm search the web?
yes. ask it to look something up — "what does veo 3 cost now?" — or tap search the web when it's offered. in about 10–15 seconds a short doc opens beside the chat (on a phone, right in it): a direct answer, the findings, and every source linked. the doc lands in the signal's research row, and nixm™ remembers what it found — what comes next in the signal builds on it. quick research is 2 credits; go deeper for a longer report from several searches — 6 credits. both are charged only when the doc arrives. on a public signal, research docs are visible to anyone with the link, like stills; make the signal private and they're yours alone.
can i animate a still?
any still in a signal can be set in motion — say "animate this" (or press ANIMATE on the image) and nixm™ builds a motion pass from that exact frame: one camera move, ambient action, sound if the scene implies it. the frame stays the frame. one video credit.
a signal keeps its takes, cast and stills. open a still and ANIMATE is right there. a demo signal with nixm renders.
can i make a video longer?
yes. every finished clip has an EXTEND button — about seven more seconds, same unbroken shot, one video credit per pass. even better: ask in words. "keep going, but have her turn toward the light" gives the extension a direction, and a directed continuation almost always beats a neutral one.
can i join my takes into one video?
yes — STITCH. on a signal with two or more takes, tap STITCH above the takes, then tap 2 to 8 of them in the order you want. you see the length and the price before anything is spent: 1 video credit per 30s, up to 120s (4 credits). the takes are joined with hard cuts, each keeping its own sound, everything framed to the first take, in HD. you can also just ask: "stitch take 3, 5 and 7". the result is a new take on the signal; the originals stay. turn on + SCORE and an instrumental score is cut to the stitch's length and mixed under the takes' own sound, dialogue kept clear — pick a mood (calm, tense, warm, epic) or leave it on auto; one more video credit.
pick your takes in order, see the length and the price, one click — the stitch plays like any render and becomes the newest take. a real stitch on a test signal.
can i see and change the order of a stitch?
yes — on the takes, tap “all N” (it shows when the takes don't fit on one line) to open them all, then switch from grid to timeline. tap takes to add them: each one joins a wired line in the order you tap it, numbered on its tile. drag a take in the line to move it (on a phone, hold it a moment, then drag); × takes it out. the line shows the running length against 120s, and STITCH shows the price before anything is spent: 1 video credit per 30s, + SCORE one more. 2 to 8 takes, as with STITCH. collapse brings the row back, and your picks stay.
where are the things i made?
in the dash, under MEDIA. on a signal it lists the signal's takes, cast, stills and research — all of them, each opening in the viewer. without a signal it lists this session's renders until the page reloads, like the chat. the row shows once there's something to list, or while something is rendering.
can i ask for another render while one is still going?
yes. in the same tab, a new video or scene waits in line and starts when the one before it lands, and you'll see it marked as queued. stills start right away. other tabs, devices and people in the signal don't wait on your line, their renders run alongside yours.
what is CAST?
a signal can hold a cast — characters you've established with reference images. upload a face, or use a frame nixm™ already rendered, give it a name, and it stays. then put that character in a new scene: a different place, a different action, same face. nixm calls it a scene; you'll see the shot and the price before anything is spent.
how do i add someone to the cast?
attach an image in the conversation and tell nixm™ who it is. one image at a time — nixm asks whether each new one is a new character or another angle of someone you already have. a character can hold up to four images (one main, three angles), which is what keeps the face consistent.
what can i upload?
images you own or have the right to use — photos of yourself, people who have agreed to be there, things you shot, frames nixm™ already rendered for you, and short clips you shot. one at a time: an image under 12mb, a clip of 3 to 90 seconds up to 250 MB (REMIX works on clips up to 30 seconds; a STITCH is up to 120 seconds in all).
what does not belong here: anyone under 18, anything sexual, real people who have not agreed — public figures included — and characters or footage someone else owns. a costumed superhero is somebody's property even when a model draws it happily. the model's filter is not the rule; this is.
uploads are screened automatically and spot-checked by a person. anything outside those lines is removed, and the account with it. everything else dissolves with the signal, as usual.
can i bring my own clip?
yes — drop a clip of 3 to 90 seconds, up to 250 MB, into a signal while signed in. it lands as a take, marked uploaded: REMIX it if it runs 30 seconds or less, or STITCH it with other takes, up to 120 seconds in all. it's screened like images, and it dissolves with the signal. without a signal open, nixm starts one to hold it.
can i add several files at once?
yes — open the dash and tap upload. add up to 8 images or clips, name the images if you like, and upload them in one go: no message, no credit. they're screened like any upload and land in media, and nixm knows them by name on your next message. with no signal open they stay with this session and move onto your signal when you start one — anything made or uploaded without a signal is deleted after seven days. sign in to upload.
what does a scene cost?
1 video credit per 5 seconds, rounded up — 10 seconds is 2, 15 is 3, 30 is 6 — however many characters or shots are in it. sound is always included. nixm™ shows you the cast, the shot and the price first — nothing renders until you say go.
how long does a scene take?
about 5 to 10 minutes — a 30-second scene takes the longest. these are bigger renders than a standard clip. you can close the page; the clip lands on the signal when it's done.
how many characters can a scene hold?
a scene holds four references — cast and props together. three characters and a prop, two characters and two props, four faces. more than that and someone doesn't make it into the frame; nixm™ proposes inside the limit and says what it cut. each character can carry up to three angles — one photo works, three hold better.
what can a scene actually hold?
less than a sentence can ask for. one camera position per shot: a longer scene is cut into shots, one per beat, up to thirty seconds in all — a camera drifting across faces inside one shot costs a face. give an outfit in words, one sentence per person, and nixm writes it into the scene — and keeps it on that character in later scenes. to hold one look exactly across many scenes, render a still of them in it and cast that; an outfit stored as a reference works too, said as wearing it. the one limit: nixm never undresses, exposes or sexualizes a real person in an uploaded photo. one character wearing a stored outfit per scene is what holds today, and a print on a shirt needs a medium shot or closer to read. nixm knows these limits and proposes within them — when your ask runs past, it tells you what it trimmed, or offers two scenes.
can a character talk?
yes. lip sync works: a line you write is spoken on the character's lips. short lines fit an 8-second shot; a longer speech splits across shots.
can i cast a face nixm™ rendered, not one i uploaded?
yes. render the still, then say cast her as vesper — naming it is what makes it a cast member. it moves into the cast strip and works exactly like an upload.
can i rename a character?
yes, any time — just ask. the new name sticks to that character and nixm™ uses it from then on.
do my uploaded references stay private?
they live in the signal, like everything else you make there — and they dissolve with it. a public signal shows its cast to anyone with the link; mark the signal private and it's yours alone. either way, nothing is trained on and nothing outlives the signal. one exception, stated plainly: uploads are screened for safety, and a person may look at an image for that reason — never at your dialogue.
what does "seeding" mean?
seeding is how you set the frequency. instead of just asking a question, you give nixm™ context: your goal, your mindset, your constraints. it locks to that — and every response from then on stays anchored to what you actually wanted.
how is this different from a chatbot?
a chatbot is stateless — it treats every message as a fresh transaction. nixm™ uses a contextual anchor that keeps your original intent alive across the whole session. it doesn't drift. it doesn't forget what you came to do.
why does the interface change color? can i pick my own?
the color shift is a live readout of the session's state — thinking, idle, reacting. it's a small feedback loop between the AI's processing and your visual field. signal activity made visible. want a different color? just ask — "use green", "tone down the background".
what happens when a signal expires?
signals live for seven days from creation. after that, the signal dissolves — its intent, its distilled log and any images you uploaded — and nothing of it remains. anything made or uploaded without a signal is deleted after seven days. nixm™ is built on the principle of ephemeral intelligence: no transcript of your conversation is ever kept. the insights are yours. the noise is deleted. nothing is harvested. you can watch it happen: every signal, alive.
an expired link opens onto nothing. nixm says so, and you seed a new one. a demo.
can a signal live longer than seven days?
yes — now it can. one credit adds seven days to a signal you own. press "+7 days" in your dash as many times as you like; the days stack. dissolving stays the default — keeping something alive is a choice you make, not a setting you forget.
can i end a signal before seven days?
yes. press "dissolve" in your dash, beside the privacy toggle — it appears only on signals you own. one tap arms it, a second confirms, and the dialogue, its images and its clips go immediately. private hides a signal; dissolve ends it. there is no undo, which is the point.
made a signal without signing in and want it gone early?
signals made without an account have no owner, so there's no dissolve button. email info@nixm.ai with the signal's id (NIXM-…) and we'll dissolve it by hand — nothing else about you is needed. do nothing and it dissolves on its own seven days after it was made.
how do i delete my account?
email info@nixm.ai from the address on the account and ask. we delete the account, its credits and everything tied to it — your signals, their images and clips, your sign-in. unused credits go with it: they only live while the account is open. your signals dissolve on their own anyway; this ends them sooner. there is no undo. stripe keeps its own record of what you paid, as the law requires.
what survives after a signal dissolves?
whatever you took out. the frames and clips you downloaded are yours forever — the conversation is the part that expires. nothing is kept, nothing is harvested. that's not a limitation of the product; it is the product.
is nixm™ open source?
no. the orchestration layer, contextual anchor logic, and session architecture are proprietary. this isn't a wrapper — it's a custom-built framework designed to keep your intent alive across a session in a way standard AI cannot.
is nixm™ private?
structurally, yes. nixm™ doesn't keep a transcript of your conversation. a distilled log stays with the signal for seven days, then dissolves — and nothing you type is used for training. and if you need something from a past session — just ask again. your thinking stays yours because we never kept a transcript of it.
one clarification: a shared nixm carries your intent seed publicly — that's the feature. anyone with the link enters the same focused context. what stays private is the dialogue itself: no transcript of it is kept. the signal's distilled log is part of that shared context, and it dissolves with the signal after seven days. you control what you seed. nixm™ controls nothing after that.
the web server keeps a standard access log for about seven days (IP, page, time); nothing else about your visit is logged by the server.
what does threadless mean?
most chats are one long thread: every message stays, and the whole history goes back to the model each turn. nixm™ has no thread. the signal holds your intent and a short distilled log of what's been decided — not a transcript. each reply works from those plus the last few exchanges, which are forgotten an hour after your last message. the log dissolves with the signal after seven days. we tested a signal against a full thread →
what does private by design mean?
nixm™ is built privacy-first. no transcript of your conversation is kept, and what you take out of a signal is yours. signed in, you run the signals you own from your dash: extend one, dissolve it early, or make it private so its link works only for you. otherwise anyone with the link can open it. do nothing and it dissolves after seven days.
can i share a nixm with someone else?
yes. every nixm is shareable by default. when you create a nixm, you can share the link and anyone who opens it enters the same focused intelligence you created. they don't need to set up context — the nixm holds it.
are my signals public or private?
by default, signals you create while logged out are public — anyone with the link can open them. once you log in, you can mark any signal you own as private: the link still works only for you, never for anyone else. toggle privacy in your dash, beside dissolve, when you're signed in.
what does everything cost?
a message costs 1 credit. an image adds 2 more — charged only when the image actually arrives. a web search adds 2 the same way, and going deeper adds 6 — both charged only when the doc arrives. video runs on its own separate pool: 1 video credit for HD, 2 for 4K, charged when the clip is delivered. a cinematic scene with your cast is 2 credits at 10 seconds, 3 at 15. extending a clip is 1 video credit per pass; keeping a signal alive is 1 credit per +7 days.
what if a render fails?
you pay for the message, never for media that didn't arrive. a failed or filtered render doesn't charge the image or video part — that's charged at delivery, on purpose.
do credits expire?
no. never. they'll be waiting whenever the next idea is.
how do i redeem a gift code?
sign in (free — a magic link, no password), open the sign-in panel, and tap have a gift code?. enter the code — credits land instantly on your account. gift codes never expire, and one code redeems once, on any account.
i lost my gift code or the email — can it be recovered?
yes. the code was emailed to the buyer (and to the recipient, if one was added at checkout) — search your inbox for "nixm". if the email is gone, the buyer can write to info@nixm.ai with the purchase email address and we'll look it up. unredeemed codes stay valid indefinitely.
are downloaded files safe to run?
nixm™ produces real, executable code. before running anything you download, open it in an editor and read it first. treat it like code from any source on the internet — not magic, not malware, just code. use your discretion.
what can i actually ask nixm to do?
more than people expect. nixm™ isn't a chatbot — it's a primed surface for shaping work. some examples to try:
what
try this
build a tool
build a beatbox in vanilla js. build a QR code generator. build a markdown editor with live preview.
visualize an idea
visualize photosynthesis in 3d. show me q1 growth as a chart. animate how a transformer works.
write a brief or doc
write a brand brief in editorial tone. draft a one-page hiring rubric. summarize this thread into a memo.
think out loud
walk me through pricing for a 50-person agency. compare two technical approaches. roast my product copy.
study or learn
explain mitochondria like i'm 14. quiz me on the krebs cycle. visualize the periodic table by reactivity.
look something up
what does veo 3 cost now? is pika still around? compare runway and kling prices.
iterate
refine the last response, but tighter. give me a more cynical version. cut everything that's not specific.
if it can be described, you can ask it. nixm™ answers the way the signal is primed.
questions fréquentes.
qu'est-ce qu'un nixm, exactement ?
un nixm est une URL unique qui transporte avec elle votre contexte d'IA déjà amorcé. vous l'amorcez avec une intention, il se verrouille sur cette fréquence, et quiconque ouvre le lien entre dans la même intelligence focalisée que vous avez créée. aucune configuration, aucune explication à refaire.
nixm™, un nixm, un signal — lequel est lequel ?
trois mots, trois choses.
nixm™ est l'interface — ce que vous utilisez en ce moment même.
un nixm est ce que vous créez avec : une URL qui porte votre intention. amorcez-en un, partagez-le, revenez-y.
un signal est l'intention elle-même, verrouillée. chaque nixm en porte un — c'est ce qui le fait tenir. (en coulisses, il est amorcé sur deux : un signal d'intention et un signal de collab. c'est la mécanique, rien que vous ayez à régler.)
en bref : vous utilisez nixm™ pour créer un nixm, et le signal est ce qui est verrouillé dedans.
est-ce que le nom nixm veut dire quelque chose ?
pas vraiment. c'est un nom — court, un peu étrange au début, et on s'y attache.
est-ce que nixm peut me montrer des choses — graphiques, visuels, démos ?
oui. demandez à nixm™ de montrer, visualiser, rendre ou animer quelque chose et le résultat s'affiche en direct dans le fil — particules, scènes 3D, graphiques, démos interactives. les données et les idées, rendues visibles. pour du code que vous voulez conserver, copier ou modifier, demandez-lui plutôt de construire quelque chose — vous obtenez alors la source complète, avec une barre d'outils pour agrandir, copier et exporter. pour des images, demandez-lui de générer une image — carrée, paysage ou portrait, affichée dans le fil.
nixm peut-il chercher sur le web ?
oui. demandez-lui de chercher quelque chose — « combien coûte veo 3 aujourd'hui ? » — ou touchez search the web quand il le propose. en 10 à 15 secondes environ, un court document s'ouvre à côté de la conversation (sur téléphone, dedans) : une réponse directe, les constats, et chaque source en lien. le document rejoint la rangée « research » du signal, et nixm™ retient ce qu'il a trouvé — la suite du signal s'appuie dessus. une recherche rapide coûte 2 crédits ; touchez go deeper pour un rapport plus long, tiré de plusieurs recherches — 6 crédits. les deux sont prélevés seulement à l'arrivée du document. sur un signal public, les documents de recherche sont visibles par toute personne qui a le lien, comme les images ; rendez le signal privé et ils ne sont qu'à vous.
puis-je animer une image fixe ?
n'importe quelle image fixe d'un signal peut être mise en mouvement — dites « anime ça » (ou appuyez sur ANIMATE sur l'image) et nixm™ construit une passe de mouvement à partir de cette image exacte : un mouvement de caméra, une action d'ambiance, du son si la scène l'appelle. l'image reste l'image. un crédit vidéo.
puis-je allonger une vidéo ?
oui. chaque clip terminé porte un bouton EXTEND — environ sept secondes de plus, le même plan ininterrompu, un crédit vidéo par passe. mieux encore : demandez-le avec des mots. « continue, mais fais-la se tourner vers la lumière » donne une direction à l'extension, et une continuation dirigée vaut presque toujours mieux qu'une continuation neutre.
puis-je assembler mes prises en une seule vidéo ?
oui — ASSEMBLER. sur un signal qui a au moins deux prises, touchez ASSEMBLER au-dessus des prises, puis 2 à 8 d'entre elles dans l'ordre voulu. vous voyez la durée et le prix avant que quoi que ce soit ne soit dépensé : 1 crédit vidéo par tranche de 30s, jusqu'à 120s (4 crédits). les prises sont jointes en coupes franches, chacune garde son propre son, le tout cadré sur la première prise, en HD. vous pouvez aussi simplement le demander : « assemble les prises 3, 5 et 7 ». le résultat est une nouvelle prise sur le signal ; les originales restent. activez + MUSIQUE et une musique instrumentale est coupée à la durée de l'assemblage et mixée sous le son des prises, les dialogues restent clairs — choisissez une ambiance (calme, tendue, chaleureuse, épique) ou laissez auto ; un crédit vidéo de plus.
choisissez vos prises dans l'ordre, voyez la durée et le prix, un clic — l'assemblage se lit comme tout rendu et devient la prise la plus récente. un vrai assemblage sur un signal de test.
puis-je voir et changer l'ordre d'un assemblage ?
oui — sur les prises, touchez « les N » (il apparaît quand les prises ne tiennent pas sur une ligne) pour les ouvrir toutes, puis passez de grille à frise. touchez des prises pour les ajouter : chacune rejoint une ligne reliée dans l'ordre où vous la touchez, numérotée sur sa vignette. faites glisser une prise dans la ligne pour la déplacer (sur un téléphone, gardez le doigt dessus un instant, puis glissez) ; × la retire. la ligne montre la durée totale face aux 120s, et ASSEMBLER montre le prix avant toute dépense : 1 crédit vidéo par tranche de 30s, + MUSIQUE un de plus. 2 à 8 prises, comme avec ASSEMBLER. replier referme la rangée, et vos choix restent.
où sont les choses que j'ai créées ?
dans le tableau de bord, sous MÉDIAS. sur un signal, il liste ses prises, son cast, ses images et ses recherches — toutes, chacune s'ouvre dans la visionneuse. sans signal, il liste les rendus de cette session jusqu'au rechargement de la page, comme la conversation. la ligne apparaît dès qu'il y a quelque chose à lister, ou pendant un rendu.
puis-je demander un autre rendu pendant qu'un rendu est encore en cours ?
oui. dans le même onglet, une nouvelle vidéo ou scène attend son tour et démarre quand la précédente arrive, et vous la voyez marquée « en file ». les images fixes démarrent tout de suite. les autres onglets, appareils et personnes du signal n'attendent pas votre file : leurs rendus tournent en même temps que les vôtres.
qu'est-ce que CAST ?
un signal peut porter une distribution — des personnages que vous avez établis à partir d'images de référence. téléversez un visage, ou reprenez une image que nixm™ a déjà rendue, donnez-lui un nom, et il reste. vous pouvez ensuite placer ce personnage dans une nouvelle scène : un autre lieu, une autre action, le même visage. nixm appelle ça une scène ; vous verrez le plan et le prix avant que quoi que ce soit ne soit dépensé.
comment ajouter quelqu'un à la distribution ?
attachez une image dans la conversation et dites à nixm™ de qui il s'agit. une image à la fois — nixm demande si chaque nouvelle image est un nouveau personnage ou un autre angle de quelqu'un que vous avez déjà. un personnage peut porter jusqu'à quatre images (une principale, trois angles), et c'est ce qui garde le visage constant.
que puis-je téléverser ?
des images que vous possédez ou que vous avez le droit d'utiliser — vos propres photos, des personnes qui ont donné leur accord, ce que vous avez filmé ou photographié, des images que nixm™ a déjà produites pour vous, et de courts clips que vous avez filmés. un à la fois : une image sous 12 mo, un clip de 3 à 90 secondes jusqu'à 250 mo (le REMIX fonctionne sur les clips de 30 secondes au plus ; un assemblage dure 120 secondes au plus au total).
ce qui n'a pas sa place ici : toute personne de moins de 18 ans, tout contenu sexuel, toute personne réelle qui n'a pas donné son accord — personnalités publiques comprises — et tout personnage ou extrait appartenant à autrui. un super-héros costumé appartient à quelqu'un, même quand un modèle le dessine sans broncher. le filtre du modèle n'est pas la règle ; celle-ci l'est.
les téléversements font l'objet d'un contrôle automatique et de vérifications humaines ponctuelles. tout ce qui sort de ces limites est retiré, et le compte avec. le reste se dissout avec le signal, comme d'habitude.
puis-je apporter mon propre clip ?
oui — déposez un clip de 3 à 90 secondes, jusqu'à 250 mo, dans un signal, connecté. il arrive comme une prise, marquée « uploaded » : REMIX s'il dure 30 secondes au plus, ou ASSEMBLER avec d'autres prises, 120 secondes au plus au total. il est contrôlé comme les images, et se dissout avec le signal. sans signal ouvert, nixm en crée un pour le garder.
puis-je ajouter plusieurs fichiers à la fois ?
oui — ouvrez le tableau de bord et touchez importer. ajoutez jusqu'à 8 images ou clips, nommez les images si vous voulez, et importez-les d'un coup : sans message, sans crédit. ils sont vérifiés comme tout import et arrivent dans les médias, et nixm les connaît par leur nom dès votre prochain message. sans signal ouvert, ils restent avec cette session et passent sur votre signal quand vous en lancez un — tout ce qui est créé ou importé sans signal est supprimé après sept jours. connectez-vous pour importer.
combien coûte une scène ?
1 crédit vidéo par tranche de 5 secondes, arrondi au supérieur — 10 secondes valent 2 crédits, 15 en valent 3, 30 en valent 6 — quel que soit le nombre de personnages ou de plans. le son est toujours inclus. nixm™ vous montre d'abord la distribution, le plan et le prix — rien ne se rend tant que vous n'avez pas dit d'y aller.
combien de temps prend une scène ?
environ 5 à 10 minutes — une scène de 30 secondes prend le plus de temps. ce sont des rendus plus lourds qu'un clip standard. vous pouvez fermer la page ; le clip arrive sur le signal une fois terminé.
combien de personnages tient une scène ?
une scène tient quatre références — distribution et accessoires compris. trois personnages et un accessoire, deux et deux, quatre visages. au-delà, quelqu'un manque à l'image ; nixm™ propose dans la limite et dit ce qu'il a retiré. chaque personnage peut porter jusqu'à trois angles — une photo suffit, trois tiennent mieux.
que peut vraiment tenir une scène ?
moins qu'une phrase peut demander. une position de caméra par plan : une scène plus longue se découpe en plans, un par temps fort, jusqu'à trente secondes au total — une caméra qui glisse d'un visage à l'autre dans un même plan coûte un visage. décrivez une tenue en mots, une phrase par personne, et nixm l'écrit dans la scène — et la garde à ce personnage dans les scènes suivantes. pour garder un même look à l'identique sur plusieurs scènes, rendez une image de lui dans cette tenue et castez-la ; une tenue enregistrée comme référence marche aussi, dite il la porte. la seule limite : nixm ne déshabille, n'expose ni ne sexualise jamais une vraie personne sur une photo importée. un personnage portant une tenue enregistrée par scène, c'est ce qui tient aujourd'hui, et un imprimé sur un t-shirt se lit en plan moyen ou plus serré. nixm connaît ces limites et propose à l'intérieur — quand la demande déborde, il dit ce qu'il a coupé, ou propose deux scènes.
puis-je renommer un personnage ?
oui, à tout moment — il suffit de le demander. le nouveau nom reste attaché à ce personnage et nixm™ l'utilise à partir de là.
mes références téléversées restent-elles privées ?
elles vivent dans le signal, comme tout ce que vous y créez — et elles se dissolvent avec lui. un signal public montre sa distribution à quiconque a le lien ; marquez le signal comme privé et elle n'appartient qu'à vous. dans les deux cas, rien ne sert à entraîner quoi que ce soit et rien ne survit au signal. une exception, dite clairement : les téléversements font l'objet d'un contrôle de sécurité, et une personne peut regarder une image à ce titre — jamais votre dialogue.
que veut dire « amorcer » ?
amorcer, c'est régler la fréquence. au lieu de simplement poser une question, vous donnez un contexte à nixm™ : votre objectif, votre état d'esprit, vos contraintes. il se verrouille dessus — et chaque réponse reste ensuite ancrée à ce que vous vouliez vraiment.
en quoi est-ce différent d'un chatbot ?
un chatbot est sans état — il traite chaque message comme une transaction isolée. nixm™ utilise un ancrage contextuel qui maintient votre intention d'origine vivante sur toute la session. il ne dérive pas. il n'oublie pas ce que vous êtes venu faire.
pourquoi l'interface change-t-elle de couleur ? puis-je choisir la mienne ?
le glissement de couleur est une lecture en direct de l'état de la session — réflexion, veille, réaction. c'est une petite boucle de retour entre le traitement de l'IA et votre champ visuel. l'activité du signal, rendue visible. vous en voulez une autre ? demandez-le simplement — « passe au vert », « adoucis le fond ».
que se passe-t-il quand un signal expire ?
les signaux vivent sept jours à compter de leur création. passé ce délai, le signal se dissout — son intention, son journal condensé et les images que vous avez importées — et il n'en reste rien. tout ce qui est créé ou importé sans signal est supprimé après sept jours. nixm™ repose sur le principe d'une intelligence éphémère : aucune transcription de votre conversation n'est jamais conservée. les idées sont à vous. le bruit est supprimé. rien n'est exploité. vous pouvez le voir se produire : chaque signal, vivant.
un signal peut-il vivre plus de sept jours ?
oui — c'est désormais possible. un crédit ajoute sept jours à un signal qui vous appartient. appuyez sur « +7 days » dans votre tableau de bord autant de fois que vous le souhaitez ; les jours s'additionnent. la dissolution reste le comportement par défaut — garder quelque chose en vie est un choix que vous faites, pas un réglage que vous oubliez.
puis-je mettre fin à un signal avant sept jours ?
oui. appuyez sur « dissoudre » dans votre tableau de bord, à côté du réglage de confidentialité — il n'apparaît que sur les signaux qui vous appartiennent. une pression l'arme, une seconde confirme, et le dialogue, ses images et ses clips disparaissent immédiatement. privé le masque ; dissoudre y met fin. il n'y a pas de retour en arrière, et c'est voulu.
signal créé sans compte : comment le supprimer plus tôt ?
un signal créé sans compte n'a pas de propriétaire, donc pas de bouton « dissoudre ». écrivez à info@nixm.ai avec l'identifiant du signal (NIXM-…) et nous le dissoudrons à la main — rien d'autre sur vous n'est nécessaire. sinon, il se dissout tout seul sept jours après sa création.
comment supprimer mon compte ?
écrivez à info@nixm.ai depuis l'adresse du compte. nous supprimons le compte, ses crédits et tout ce qui y est lié — vos signaux, leurs images et leurs clips, votre connexion. les crédits inutilisés disparaissent avec lui : ils n'existent que tant que le compte est ouvert. vos signaux se dissolvent de toute façon d'eux-mêmes ; ceci y met fin plus tôt. il n'y a pas de retour en arrière. stripe conserve sa propre trace de vos paiements, comme la loi l'exige.
que reste-t-il après la dissolution d'un signal ?
ce que vous en avez sorti. les images et les clips que vous avez téléchargés sont à vous pour toujours — c'est la conversation qui expire. rien n'est conservé, rien n'est récolté. ce n'est pas une limite du produit ; c'est le produit.
nixm™ est-il open source ?
non. la couche d'orchestration, la logique d'ancrage contextuel et l'architecture de session sont propriétaires. ce n'est pas un wrapper — c'est un cadre sur mesure conçu pour garder votre intention vivante sur toute une session, ce que l'IA standard ne sait pas faire.
nixm™ est-il privé ?
structurellement, oui. nixm™ ne conserve aucune transcription de votre conversation. un journal condensé reste avec le signal pendant sept jours, puis se dissout — et rien de ce que vous tapez ne sert à entraîner un modèle. et si vous avez besoin de quelque chose d'une session passée — redemandez, simplement. votre pensée reste la vôtre parce que nous n'en gardons jamais la transcription.
une précision : un nixm partagé transporte publiquement votre amorce d'intention — c'est justement la fonctionnalité. quiconque a le lien entre dans le même contexte focalisé. ce qui reste privé, c'est le dialogue lui-même : aucune transcription n'en est conservée. le journal condensé du signal fait partie de ce contexte partagé, et il se dissout avec le signal au bout de sept jours. vous contrôlez ce que vous amorcez. nixm™ ne contrôle rien au-delà.
le serveur web conserve un journal d'accès standard pendant environ sept jours (IP, page, heure) ; le serveur ne consigne rien d'autre sur votre visite.
que veut dire « aucun fil » ?
la plupart des chats sont un long fil : chaque message reste, et tout l'historique repart vers le modèle à chaque tour. nixm™ n'a pas de fil. le signal porte votre intention et un court journal condensé de ce qui a été décidé — pas une transcription. chaque réponse part de ces deux éléments et des derniers échanges, oubliés une heure après votre dernier message. le journal se dissout avec le signal après sept jours. on a comparé un signal à un fil complet →
que veut dire « privé par conception » ?
nixm™ est conçu d'abord pour la vie privée. aucune transcription de votre conversation n'est conservée, et ce que vous sortez d'un signal vous appartient. un signal qui vous appartient se gère depuis votre tableau de bord, une fois connecté : prolongez-le, dissolvez-le plus tôt, ou rendez-le privé pour que son lien ne fonctionne que pour vous. sinon, quiconque a le lien peut l'ouvrir. si vous ne faites rien, il se dissout au bout de sept jours.
puis-je partager un nixm avec quelqu'un d'autre ?
oui. chaque nixm est partageable par défaut. quand vous créez un nixm, vous pouvez en partager le lien, et quiconque l'ouvre entre dans la même intelligence focalisée que vous avez créée. la personne n'a aucun contexte à mettre en place — le nixm le retient.
mes signaux sont-ils publics ou privés ?
par défaut, les signaux que vous créez sans être connecté sont publics — quiconque a le lien peut les ouvrir. une fois connecté, vous pouvez marquer comme privé n'importe quel signal qui vous appartient : le lien ne fonctionne alors que pour vous, jamais pour quelqu'un d'autre. la confidentialité se règle dans votre tableau de bord, à côté de « dissoudre », lorsque vous êtes connecté.
combien coûte l'ensemble ?
un message coûte 1 crédit. une image en ajoute 2 — facturés seulement quand l'image arrive vraiment. une recherche web en ajoute 2 de la même façon, et l'approfondir en ajoute 6 — facturés seulement à l'arrivée du document. la vidéo fonctionne sur une réserve séparée : 1 crédit vidéo en HD, 2 en 4K, facturés à la livraison du clip. une scène cinématique avec votre distribution coûte 2 crédits à 10 secondes, 3 à 15. prolonger un clip coûte 1 crédit vidéo par passe ; garder un signal en vie coûte 1 crédit par tranche de +7 jours.
et si un rendu échoue ?
vous payez le message, jamais un média qui n'est pas arrivé. un rendu qui échoue ou qui est filtré ne facture pas la partie image ou vidéo — celle-ci est facturée à la livraison, délibérément.
les crédits expirent-ils ?
non. jamais. ils vous attendront jusqu'à la prochaine idée.
comment utiliser un code cadeau ?
connectez-vous (c'est gratuit — un lien magique, sans mot de passe), ouvrez le panneau de connexion et touchez un code cadeau ?. saisissez le code — les crédits arrivent immédiatement sur votre compte. les codes cadeaux n'expirent jamais, et un code s'utilise une seule fois, sur n'importe quel compte.
j'ai perdu mon code cadeau ou l'e-mail — peut-on le retrouver ?
oui. le code a été envoyé par e-mail à l'acheteur (et au destinataire, si l'un a été ajouté au moment du paiement) — cherchez « nixm » dans votre boîte de réception. si l'e-mail a disparu, l'acheteur peut écrire à info@nixm.ai avec l'adresse e-mail utilisée pour l'achat et nous le retrouverons. les codes non utilisés restent valables indéfiniment.
les fichiers téléchargés peuvent-ils être exécutés sans risque ?
nixm™ produit du code réel, exécutable. avant de lancer quoi que ce soit que vous avez téléchargé, ouvrez-le dans un éditeur et lisez-le d'abord. traitez-le comme du code venant de n'importe quelle source sur internet — ni magie, ni logiciel malveillant, juste du code. à vous de juger.
que puis-je réellement demander à nixm ?
plus de choses qu'on ne l'imagine. nixm™ n'est pas un chatbot — c'est une surface amorcée pour façonner du travail. quelques exemples à essayer :
quoi
essayez ceci
construire un outil
construis une boîte à rythmes en js pur. construis un générateur de QR code. construis un éditeur markdown avec aperçu en direct.
visualiser une idée
visualise la photosynthèse en 3d. montre-moi la croissance du t1 sous forme de graphique. anime le fonctionnement d'un transformeur.
rédiger un brief ou un document
rédige un brief de marque sur un ton éditorial. rédige une grille d'embauche d'une page. résume ce fil en une note.
réfléchir à voix haute
explique-moi la tarification pour une agence de 50 personnes. compare deux approches techniques. démolis le texte de mon produit.
étudier ou apprendre
explique-moi les mitochondries comme si j'avais 14 ans. interroge-moi sur le cycle de krebs. visualise le tableau périodique par réactivité.
chercher quelque chose
combien coûte veo 3 aujourd'hui ? pika existe-t-il encore ? compare les prix de runway et de kling.
itérer
affine la dernière réponse, mais plus serrée. donne-moi une version plus cynique. coupe tout ce qui n'est pas précis.
si ça peut se décrire, ça peut se demander. nixm™ répond à la mesure de l'amorce du signal.
Terms
conditions of use.
nixm™ is an experimental environment. by entering a signal, you acknowledge the transient nature of the data and accept these conditions.
intellectual property. the nixm™ interface logic, contextual anchor framework, and session architecture are proprietary. unauthorized replication of this architecture is prohibited.
what you upload. you can attach an image to a signal — as a reference for a character, or as a frame to set in motion. by uploading, you confirm three things: you made it or you hold the rights to use it; every identifiable person in it is an adult who has agreed to appear; and it contains none of the material listed below. you keep ownership of what you upload. you grant us only what running the service requires — storing the file, passing it to the model providers that render your work, and displaying it inside your signal — for as long as that signal lives, and no longer. we do not train on it and we do not license it to anyone.
what does not belong here. no one under 18 — not as a character, not in the frame. nothing sexual. no real person who has not agreed to be there, public figures included, and no face used to suggest someone said or did something they did not. no characters, logos, or footage owned by someone else — a costumed superhero, a film still, a game character, a brand mark. nothing hateful, harassing, or promoting violence or self-harm. no identity documents, payment cards, or other people's private information. nothing illegal where you are.
generated output. models are imperfect and their filters are incomplete. a render may resemble a protected character or a real person even when you did not ask for one. if that happens, do not publish it — tell us and we will remove it. what you take out of a signal is yours to use, and yours to be responsible for, including whether you hold the rights to use it commercially where you are.
you are talking to a machine. nixm is an AI system. the character you speak with is software. it is not a person, it does not know you, and nothing it says is advice.
everything here is generated. images, video, voice and text made on nixm are produced by AI models. none of it is a recording of something that happened. if you publish a render that depicts a real person, or that a viewer could reasonably mistake for real footage, you may be legally required to label it as artificially generated — in the European Union this has been required since 2 August 2026, and other places are following. nixm does not apply that label for you. judging whether you need one, and applying it, is yours.
moderation and removal. uploads are screened automatically and may also be reviewed by a person. we may refuse, remove, or delete any upload or render, and suspend or terminate any account, at our discretion and without notice. accounts that repeatedly infringe the rights of others are terminated.
data. dialogue is ephemeral by design. no transcript accumulates to be produced; what exists is a seven-day distilled log that then dissolves. signals expire and their contents dissolve. anything made or uploaded without a signal is deleted after seven days. we use standard analytics to monitor interface performance — not to harvest dialogue.
conduct. interact at your own risk. nixm™ is a thinking interface, not a publication platform. you are responsible for what you seed and what you share.
age.nixm™ is intended for users aged 16 and over. by entering a signal, you confirm you meet this minimum. accounts found to belong to users under 16 may be suspended without notice.
copyright — notice and takedown. if you believe material on nixm.ai infringes your copyright, write to info@turnlive.com and include: the work you say is infringed, the URL of the material, your contact details, a statement that you believe the use is not authorized, a statement made under penalty of perjury that the notice is accurate and that you are the owner or authorized to act for the owner, and your signature. we remove material promptly on a valid notice. counter-notices go to the same address.
designated agent details our designated agent under 17 U.S.C. § 512 is the Copyright Agent, TURNLIVE LLC, 5219 Pleasure Island Road, Belle Isle, FL 32809, info@turnlive.com.
credits. credits are prepaid, non-transferable, and have no cash value. a credit is spent when a render is requested, and a spent credit is not refundable — a render you did not like is still a render. if a render fails on our side, write to info@nixm.ai and we will restore the credit. unused credits stay on your account for as long as the account is open. if you are a consumer in the European Union or the United Kingdom, you have fourteen days to withdraw from a purchase of credits; by spending a credit within that period you ask us to begin at once and give up the right to withdraw for the credits you have spent.
no warranty. the service is provided as is. we do not guarantee availability, accuracy, or that a render will match what you pictured.
liability. to the fullest extent permitted by law, the total liability of TURNLIVE LLC for any claim relating to the service is limited to the amount you paid us in the three months before the claim arose. we are not liable for indirect or consequential loss.
indemnity. you agree to cover the costs of any third-party claim brought against us arising from what you uploaded, generated, or published from a signal.
jurisdiction. by using the service from the United Kingdom, European Economic Area, Australia, or any other jurisdiction, you agree to comply with local law in addition to these terms.
nixm™ est un environnement expérimental. en amorçant un signal, vous reconnaissez le caractère transitoire des données et acceptez ces conditions.
propriété intellectuelle. la logique d'interface nixm™, le cadre d'ancrage contextuel et l'architecture de session sont propriétaires. toute reproduction non autorisée de cette architecture est interdite.
ce que vous téléversez. vous pouvez joindre une image à un signal — comme référence pour un personnage, ou comme image à mettre en mouvement. en la téléversant, vous confirmez trois choses : vous l'avez créée ou vous en détenez les droits ; toute personne identifiable qui y figure est majeure et a donné son accord ; et elle ne contient rien de ce qui est listé ci-dessous. vous restez propriétaire de ce que vous téléversez. vous nous accordez uniquement ce que le fonctionnement du service exige — conserver le fichier, le transmettre aux fournisseurs de modèles qui produisent votre rendu, et l'afficher dans votre signal — aussi longtemps que ce signal vit, et pas au-delà. nous ne l'utilisons pas pour entraîner de modèles et nous ne le cédons à personne.
ce qui n'a pas sa place ici. aucune personne de moins de 18 ans — ni comme personnage, ni dans le cadre. rien de sexuel. aucune personne réelle qui n'a pas donné son accord, personnalités publiques comprises, et aucun visage utilisé pour laisser croire que quelqu'un a dit ou fait ce qu'il n'a pas fait. aucun personnage, logo ou extrait appartenant à autrui — super-héros costumé, photogramme de film, personnage de jeu, marque. rien de haineux, de harcelant, ni qui encourage la violence ou l'automutilation. aucun document d'identité, carte de paiement ou donnée privée d'autrui. rien d'illégal là où vous vous trouvez.
résultats générés. les modèles sont imparfaits et leurs filtres incomplets. un rendu peut ressembler à un personnage protégé ou à une personne réelle sans que vous l'ayez demandé. si cela arrive, ne le publiez pas — signalez-le-nous et nous le retirerons. ce que vous emportez d'un signal vous appartient, et vous en êtes responsable, y compris quant aux droits d'usage commercial là où vous êtes.
vous parlez à une machine. nixm est un système d'IA. le personnage avec lequel vous échangez est un logiciel. ce n'est pas une personne, il ne vous connaît pas, et rien de ce qu'il dit ne constitue un conseil.
tout ici est généré. les images, vidéos, voix et textes produits sur nixm le sont par des modèles d'IA. rien de tout cela n'est l'enregistrement d'un fait réel. si vous publiez un rendu représentant une personne réelle, ou qu'un spectateur pourrait raisonnablement prendre pour de vraies images, vous pouvez être légalement tenu de le signaler comme généré artificiellement — dans l'Union européenne, cela est exigé depuis le 2 août 2026, et d'autres juridictions suivent. nixm n'appose pas cette mention à votre place. évaluer si elle est nécessaire, et l'apposer, vous revient.
modération et retrait. les téléversements font l'objet d'un contrôle automatique et peuvent aussi être examinés par une personne. nous pouvons refuser, retirer ou supprimer tout téléversement ou rendu, et suspendre ou résilier tout compte, à notre discrétion et sans préavis. les comptes qui portent atteinte de façon répétée aux droits d'autrui sont résiliés.
données. le dialogue est éphémère par conception. aucune transcription ne s'accumule qui puisse être produite ; ce qui existe est un journal condensé de sept jours, qui se dissout ensuite. les signaux expirent et leur contenu se dissout. tout ce qui est créé ou importé sans signal est supprimé après sept jours. nous utilisons des outils d'analyse standard pour surveiller les performances de l'interface — jamais pour exploiter le dialogue.
conduite. vous interagissez à vos propres risques. nixm™ est une interface de réflexion, pas une plateforme de publication. vous êtes responsable de ce que vous amorcez et de ce que vous partagez.
âge.nixm™ s'adresse aux personnes âgées de 16 ans et plus. en amorçant un signal, vous confirmez atteindre cet âge minimum. tout compte appartenant à une personne de moins de 16 ans pourra être suspendu sans préavis.
droit d'auteur — notification et retrait. si vous estimez qu'un contenu présent sur nixm.ai porte atteinte à votre droit d'auteur, écrivez à info@turnlive.com en indiquant : l'œuvre concernée, l'URL du contenu, vos coordonnées, une déclaration selon laquelle l'usage n'est pas autorisé, une déclaration faite sous peine de parjure attestant l'exactitude de la notification et votre qualité de titulaire ou de mandataire, ainsi que votre signature. nous retirons rapidement tout contenu visé par une notification valable. les contre-notifications s'adressent au même endroit.
coordonnées de l'agent désigné notre agent désigné au sens du 17 U.S.C. § 512 est le Copyright Agent, TURNLIVE LLC, 5219 Pleasure Island Road, Belle Isle, FL 32809, info@turnlive.com.
crédits. les crédits sont prépayés, non transférables et sans valeur monétaire. un crédit est consommé dès qu'un rendu est demandé, et un crédit consommé n'est pas remboursable — un rendu qui ne vous plaît pas reste un rendu. si un rendu échoue de notre fait, écrivez à info@nixm.ai et nous vous le restituerons. les crédits inutilisés restent sur votre compte tant que celui-ci est ouvert. si vous êtes un consommateur dans l'Union européenne ou au Royaume-Uni, vous disposez de quatorze jours pour renoncer à un achat de crédits ; en consommant un crédit pendant ce délai, vous nous demandez de commencer immédiatement et renoncez au droit de rétractation pour les crédits consommés.
aucune garantie. le service est fourni « en l'état ». nous ne garantissons ni sa disponibilité, ni son exactitude, ni qu'un rendu correspondra à ce que vous imaginiez.
responsabilité. dans toute la mesure permise par la loi, la responsabilité totale de TURNLIVE LLC pour toute réclamation liée au service est limitée aux sommes que vous nous avez versées durant les trois mois précédant la réclamation. nous ne sommes pas responsables des dommages indirects ou consécutifs.
garantie d'indemnisation. vous acceptez de prendre en charge les frais de toute réclamation de tiers dirigée contre nous et découlant de ce que vous avez téléversé, généré ou publié depuis un signal.
juridiction. en utilisant le service depuis le Royaume-Uni, l'Espace économique européen, l'Australie ou toute autre juridiction, vous acceptez de respecter le droit local en complément des présentes conditions.
credits power your interactions with nixm™. each message consumes one. image generation consumes two, and you must be logged in. no subscriptions. no expiry. yours until you use them.
20
credits
FREE
sign up to claim — 20 credits + 1 free HD video, no payment needed
50
credits
CA$5.99
50 messages — no subscription
100
credits
CA$11.99
100 messages — no subscription
150
credits
CA$16.99
150 messages — no subscription
best value
100 + 5
chat + video
CA$24.99
creator pack — 100 messages & 5 videos in one. best value to start.
secure checkout · payments by Stripe
gifting nixm? creator pack as a GIFT CODE — 100 chat + 5 videos
credits never expire. one-time purchase. no recurring charges.
video runs on a separate credit pool — keeps the chat plan untouched. new accounts get 1 free HD video to try. HD burns 1 credit, 4K burns 2. cinematic scenes — a cast in a new shot — run 1 video credit per 5 seconds, 3 to 30 seconds (2 for 10s, 6 for 30s). stitching 2 to 8 takes into one is 1 credit per 30s, up to 120s (4 credits), +1 for a score under it. remixing a take of up to 30s — the same shot, changed by a sentence — is a fresh take's price +1. credits never expire.
1
encore
CA$4.99
one more clip. 1 video credit + 30 chat credits.
for when the frame deserves another take.
2
double take
CA$7.99
two clips, one idea worth chasing. 2 video credits + 50 chat credits.
for when one take was never going to be enough.
5
videos
CA$19.99
5 video credits — HD or 4K mix — no subscription
5 + 100
video + chat
CA$24.99
creator pack — 5 videos & 100 messages in one. best value to start.
15
videos
CA$54.99
15 video credits — HD or 4K mix — no subscription
best value
30
videos
CA$99.00
30 video credits — HD or 4K mix — no subscription
secure checkout · payments by Stripe
gifting nixm? creator pack as a GIFT CODE — 100 chat + 5 videos
video credits never expire. one-time purchase. no recurring charges. HD renders in ~2 min, 4K takes ~5-7 min, cinematic scenes 5-10 min.
for your dialogue, no transcript accumulates to be produced; what exists is a seven-day distilled log that then dissolves. we do not sell or share your data with third parties.
we use Google Analytics to understand how the interface is used — not what is said inside it. for users in the UK and European Economic Area, this cookie is set only after explicit consent (Google Consent Mode v2, default denied). everywhere else, it is set on entry. you can withdraw consent at any time by clearing your browser storage for this site.
our web server keeps a standard access log (IP address, page requested, time, browser) for security and to count visits; it is rotated automatically and kept for about seven days, and it is not used to build profiles.
the signal state (intent seed, session ID and a distilled log of the session) is held in a secure signal store and dissolves seven days after the signal is created. no transcript accumulates to be produced; what exists is a seven-day distilled log that then dissolves.
when you authenticate with an email magic link, we store only your email address and what is necessary to maintain your account and credit balance.
images you upload. an image you attach to a signal is stored so it can be used as a reference and shown back to you. it lives with that signal and is deleted when the signal dissolves. anything made or uploaded without a signal is deleted after seven days. it is passed to the model providers that render your work, and it is never used to train a model. uploads are screened automatically for safety, and a member of our team may review an image for the same reason — safety only, never your dialogue. you can ask us to delete an upload at any time at info@nixm.ai.
signing in with Google. when you choose to sign in with Google, we use Google OAuth solely to authenticate you. through Google Sign-In we access a limited set of Google user data: your name, your email address, your Google profile picture, and your Google account identifier. we use this data for one purpose only — to create and maintain your nixm account, recognize you when you return, and track your credit balance. we do not use Google user data for advertising, and we never use it to train AI or machine-learning models.
how Google user data is stored and shared. the account data above is held in our authentication and database systems (Supabase) and is encrypted in transit and at rest. for your signal dialogue, no transcript accumulates to be produced; what exists is a seven-day distilled log that then dissolves. we do not sell, transfer, or disclose your Google user data to third parties, except to the service providers that host and authenticate the application on our behalf, or where we are required to by law.
retention and deletion. we keep your account data only for as long as your account is active. you can request deletion of your account and all associated Google user data at any time by contacting info@nixm.ai, and we will delete it promptly.
limited use.nixm's use of information received from Google APIs adheres to the Google API Services User Data Policy, including the Limited Use requirements.
your rights (UK GDPR / EU GDPR). if you are in the UK or EEA, you have the right to access, correct, delete, or restrict processing of your personal data, and to lodge a complaint with your local supervisory authority (UK: the Information Commissioner's Office, ico.org.uk). contact info@nixm.ai to exercise any of these rights.
pour votre dialogue, aucune transcription ne s'accumule qui puisse être produite ; ce qui existe est un journal condensé de sept jours, qui se dissout ensuite. nous ne vendons ni ne partageons vos données avec des tiers.
nous utilisons Google Analytics pour comprendre comment l'interface est utilisée — pas ce qui s'y dit. pour les personnes situées au Royaume-Uni et dans l'Espace économique européen, ce cookie n'est déposé qu'après consentement explicite (Google Consent Mode v2, refus par défaut). ailleurs, il est déposé à l'entrée. vous pouvez retirer votre consentement à tout moment en effaçant le stockage de votre navigateur pour ce site.
notre serveur web conserve un journal d'accès standard (adresse IP, page demandée, heure, navigateur) à des fins de sécurité et pour compter les visites ; il est renouvelé automatiquement et conservé environ sept jours, et il ne sert pas à établir des profils.
l'état du signal (amorce d'intention, identifiant de session et journal condensé de la session) est conservé dans un stockage sécurisé et se dissout sept jours après la création du signal. aucune transcription ne s'accumule qui puisse être produite ; ce qui existe est un journal condensé de sept jours, qui se dissout ensuite.
lorsque vous vous authentifiez par lien magique envoyé par e-mail, nous ne conservons que votre adresse e-mail et ce qui est nécessaire au maintien de votre compte et de votre solde de crédits.
les images que vous téléversez. une image jointe à un signal est conservée afin de servir de référence et de vous être réaffichée. elle vit avec ce signal et est supprimée lorsque le signal se dissout. tout ce qui est créé ou importé sans signal est supprimé après sept jours. elle est transmise aux fournisseurs de modèles qui produisent votre rendu, et n'est jamais utilisée pour entraîner un modèle. les téléversements font l'objet d'un contrôle automatique de sécurité, et un membre de notre équipe peut examiner une image pour la même raison — la sécurité uniquement, jamais votre dialogue. vous pouvez demander la suppression d'un téléversement à tout moment à info@nixm.ai.
connexion avec Google. lorsque vous choisissez de vous connecter avec Google, nous utilisons Google OAuth uniquement pour vous authentifier. via Google Sign-In, nous accédons à un ensemble limité de données utilisateur Google : votre nom, votre adresse e-mail, votre photo de profil Google et votre identifiant de compte Google. nous utilisons ces données à une seule fin — créer et maintenir votre compte nixm, vous reconnaître lors de vos retours et suivre votre solde de crédits. nous n'utilisons pas les données utilisateur Google à des fins publicitaires, et nous ne les utilisons jamais pour entraîner des modèles d'IA ou d'apprentissage automatique.
conservation et partage des données utilisateur Google. les données de compte ci-dessus sont conservées dans nos systèmes d'authentification et de base de données (Supabase) et sont chiffrées en transit et au repos. pour le dialogue de vos signaux, aucune transcription ne s'accumule qui puisse être produite ; ce qui existe est un journal condensé de sept jours, qui se dissout ensuite. nous ne vendons, ne transférons ni ne divulguons vos données utilisateur Google à des tiers, sauf aux prestataires qui hébergent et authentifient l'application pour notre compte, ou lorsque la loi nous y oblige.
conservation et suppression. nous ne conservons vos données de compte que tant que votre compte est actif. vous pouvez demander la suppression de votre compte et de toutes les données utilisateur Google associées à tout moment en écrivant à info@nixm.ai, et nous procéderons à la suppression sans délai.
usage limité. l'utilisation par nixm des informations reçues des API Google est conforme à la Google API Services User Data Policy, y compris aux exigences Limited Use.
vos droits (RGPD britannique / RGPD européen). si vous résidez au Royaume-Uni ou dans l'EEE, vous disposez du droit d'accéder à vos données personnelles, de les rectifier, de les effacer ou d'en limiter le traitement, ainsi que du droit d'introduire une réclamation auprès de votre autorité de contrôle locale (Royaume-Uni : l'Information Commissioner's Office, ico.org.uk). écrivez à info@nixm.ai pour exercer l'un de ces droits.